Transform Data into Stunning Visuals with Our Free ECharts Editor

Bring your data to life with VPasCode, the premier online ECharts editor. Our intelligent and free ECharts tool offers real-time rendering, allowing you to design compelling bar charts, line graphs, pie charts, and more with unmatched ease and precision.

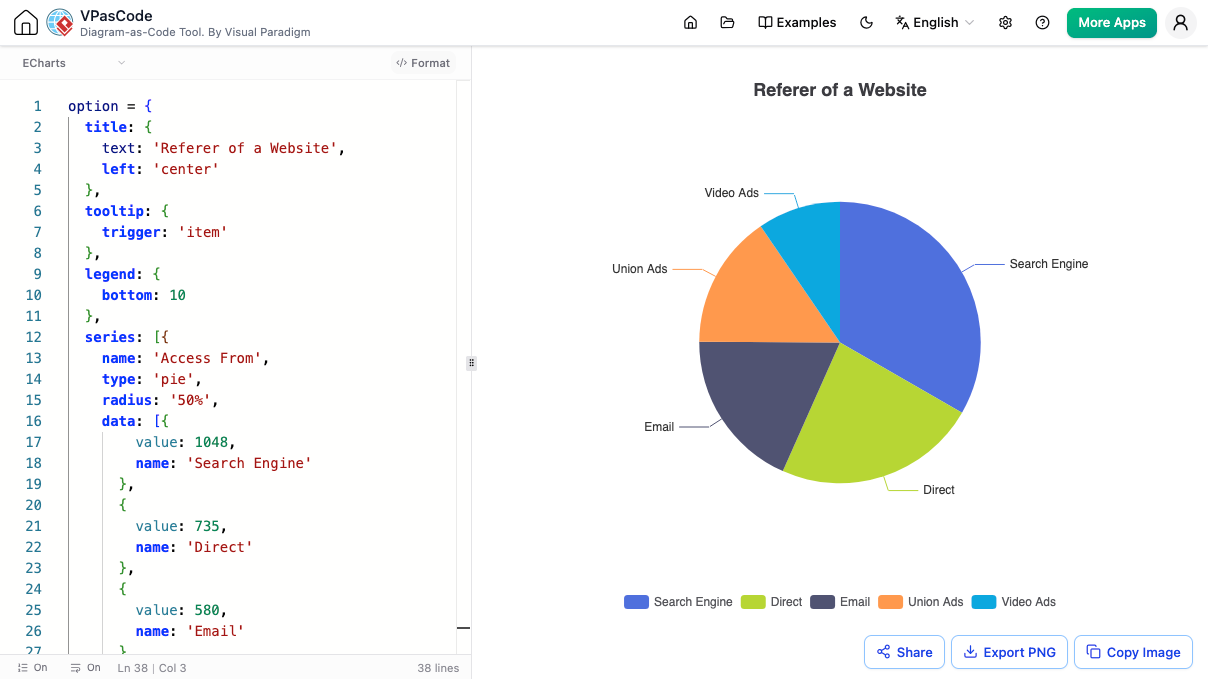
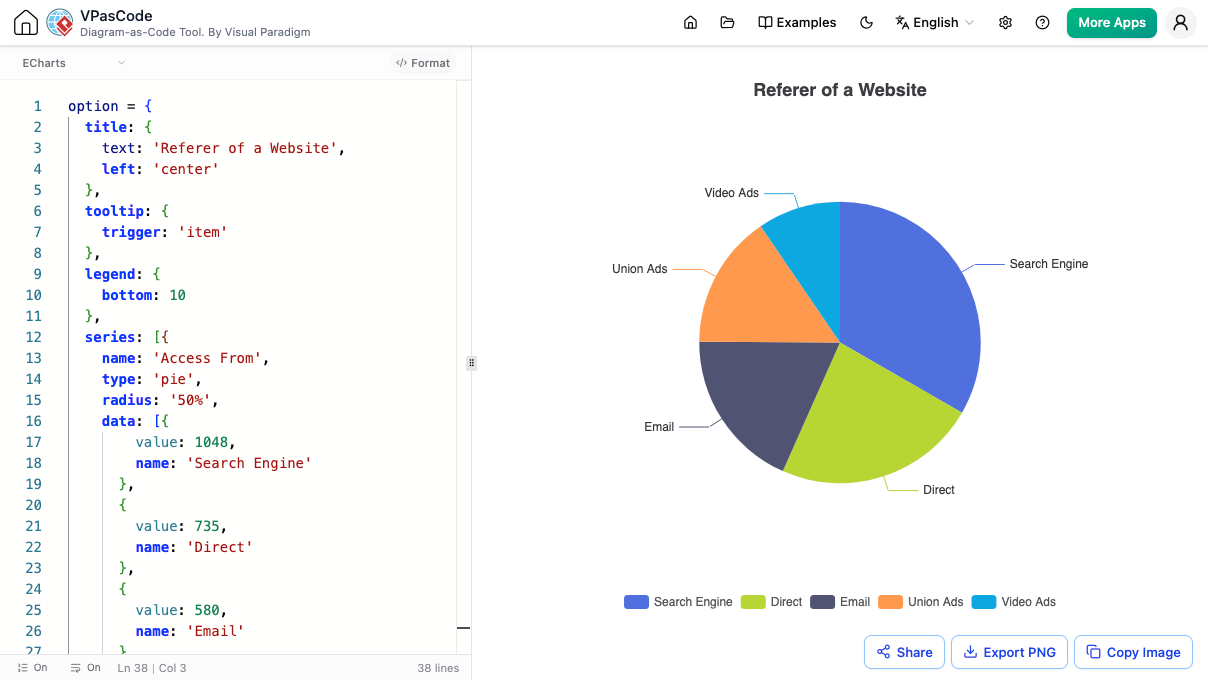
VPasCode text to diagram tool rendering a pie chart for website referral sources from ECharts code.

Struggling to Design Your ECharts Visualizations?

Configuring complex ECharts options can be time-consuming without instant feedback. You need a dedicated ECharts editor that provides immediate visualization, streamlines your workflow, and helps you master the powerful ECharts API.

Your Real-Time ECharts Design Studio

Our ECharts tool is engineered for precision and creativity. Build dynamic and interactive charts, from simple bar graphs to intricate multi-series visualizations, and see them render live as you refine your ECharts options.

Editing EChart Grouped Column Chart in text to diagram editor - VPasCode

Editing EChart Grouped Column Chart in text to diagram editor - VPasCode

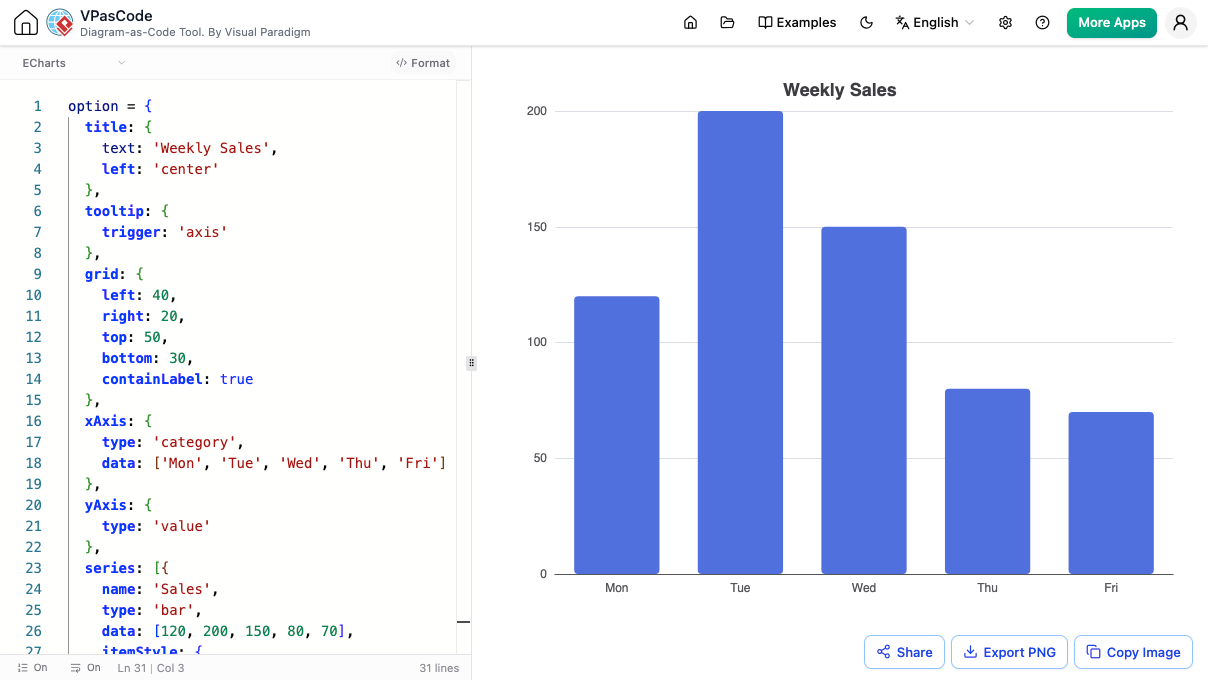
Column Chart (Grouped)
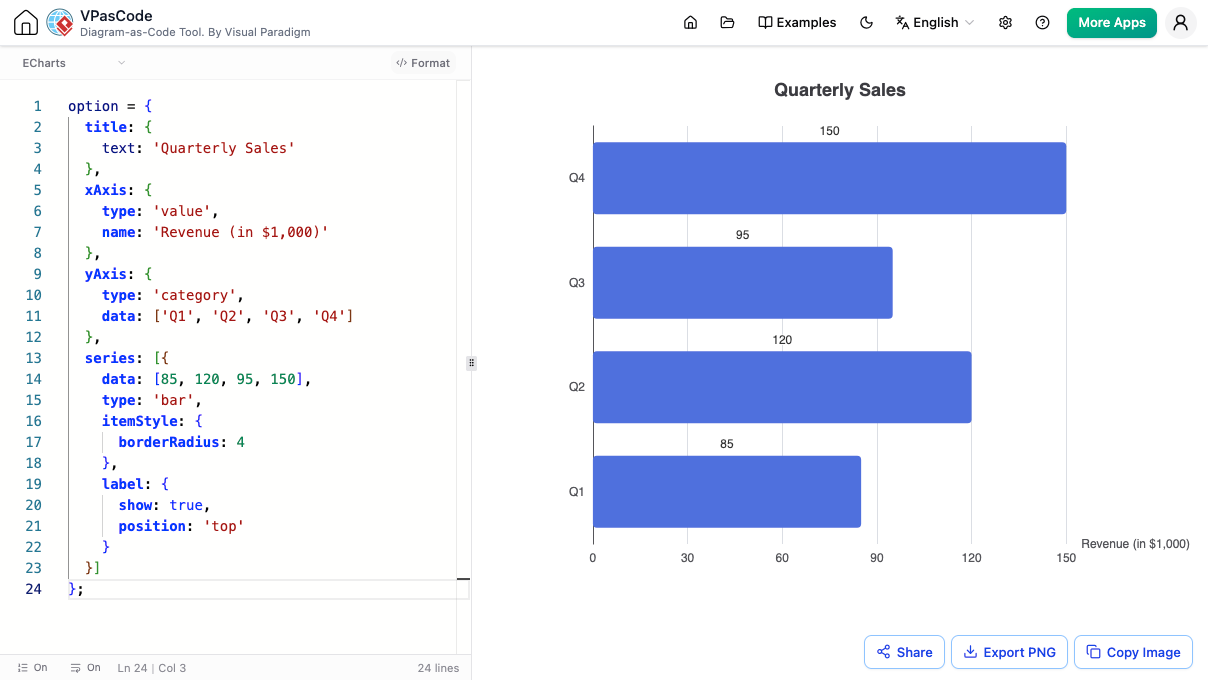
Bar Chart (Grouped)
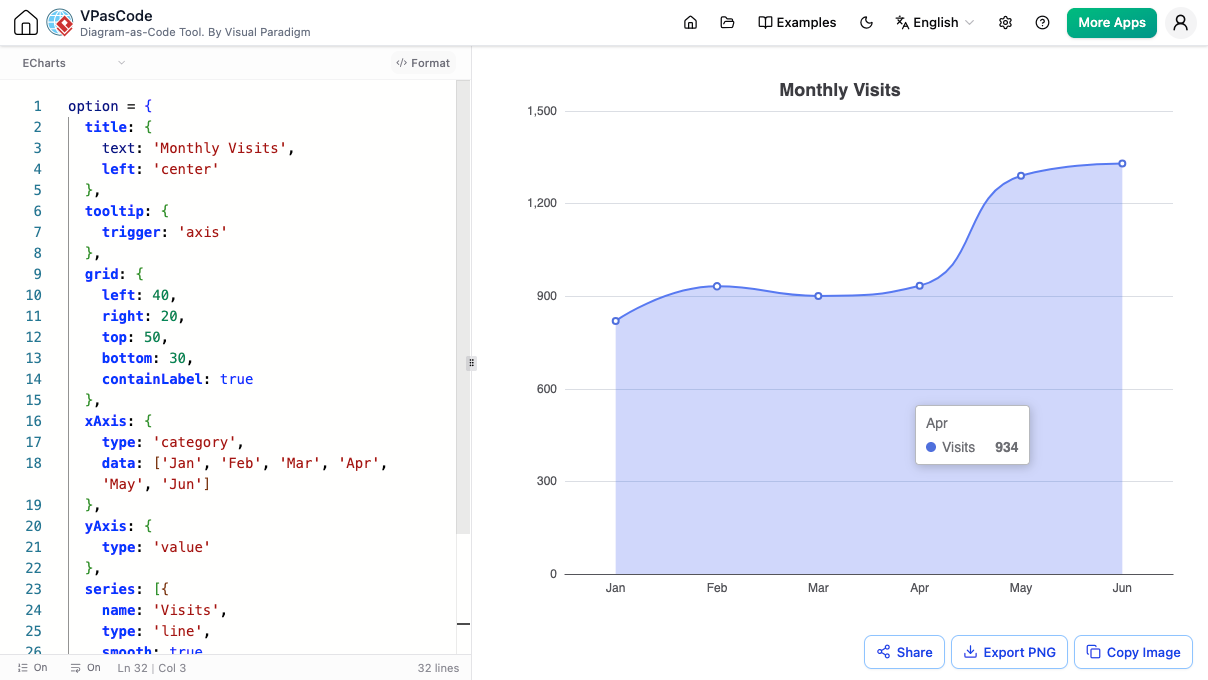
Line Chart
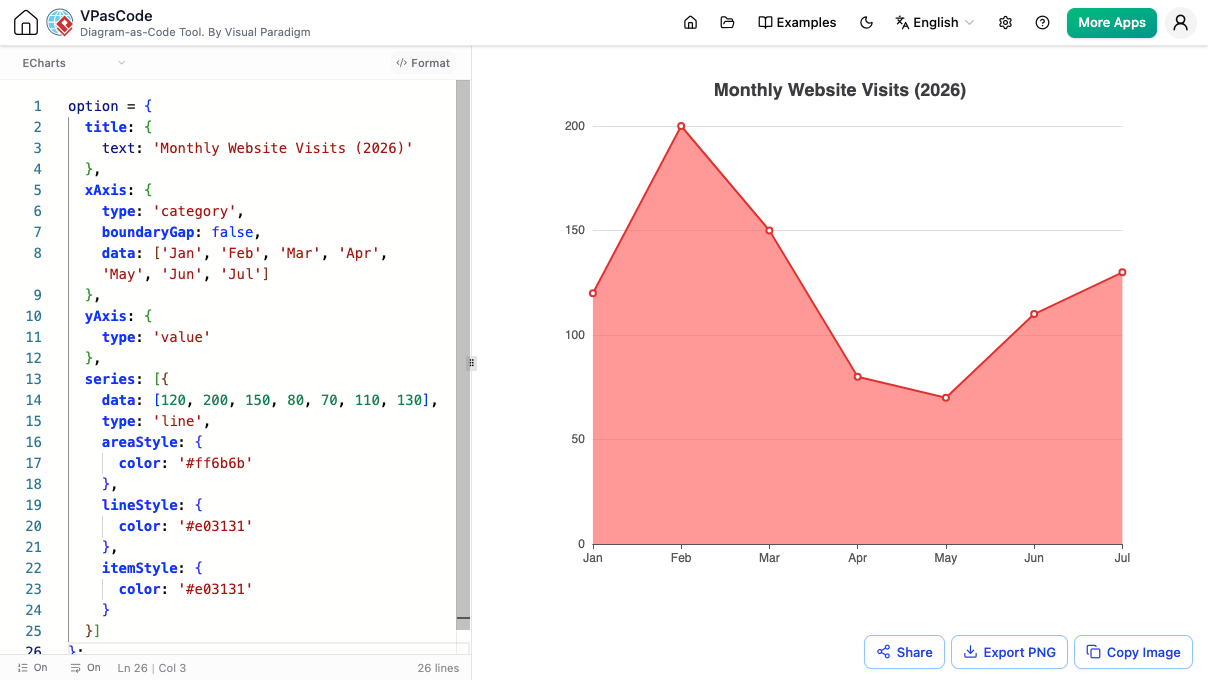
Area Chart
Pie Chart
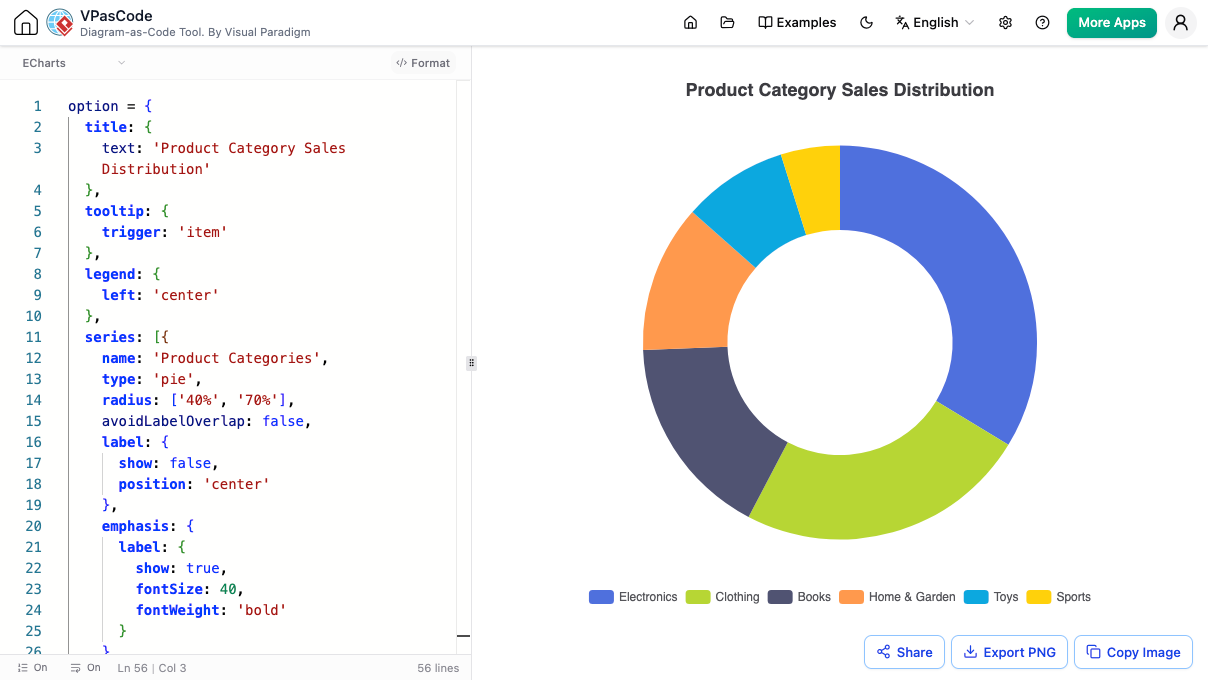
Doughnut Chart
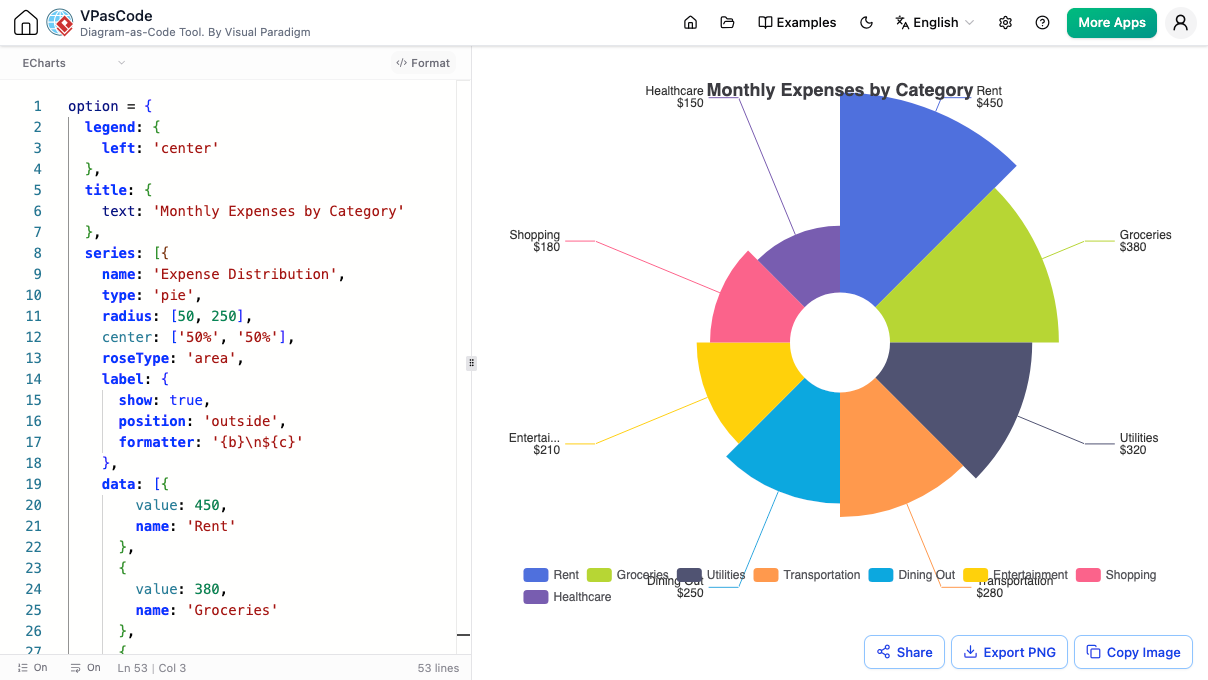
Nightingale Chart
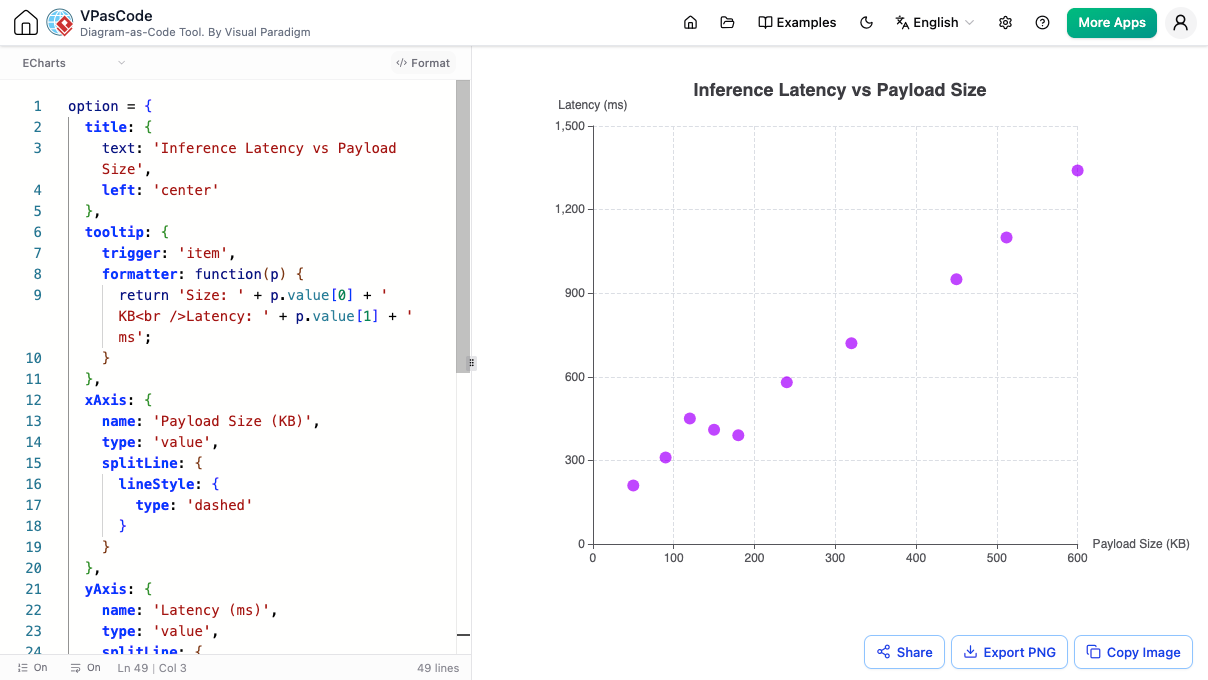
Scatter Chart
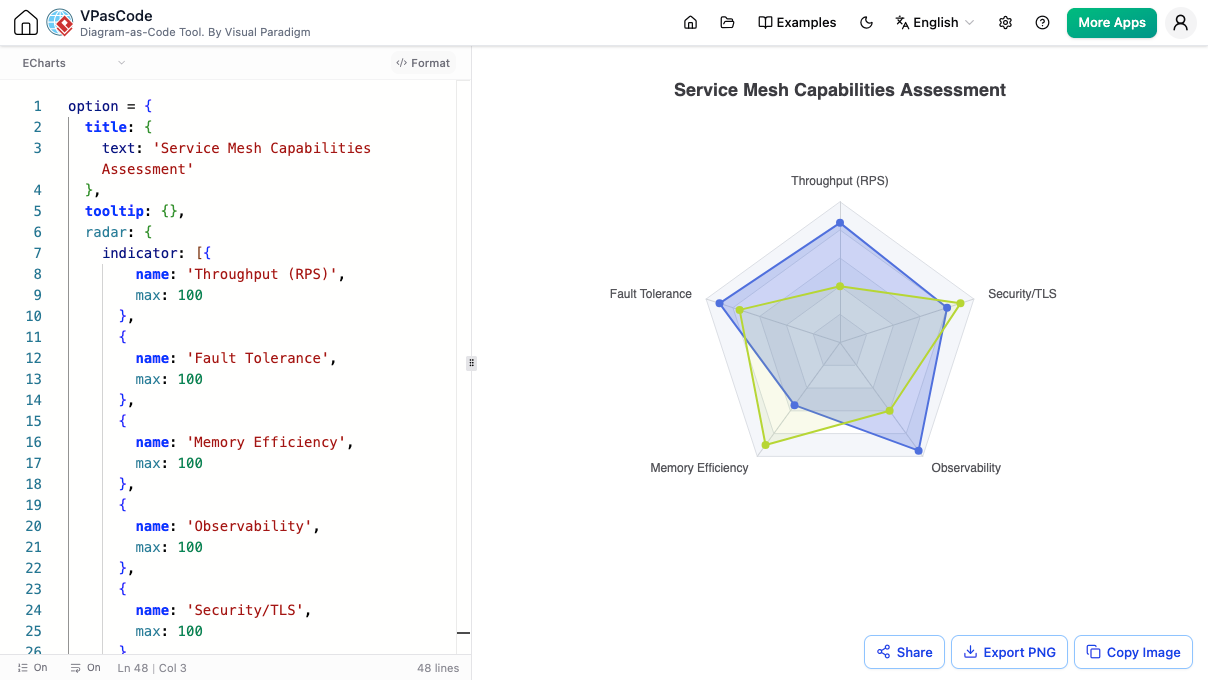
Radar Chart
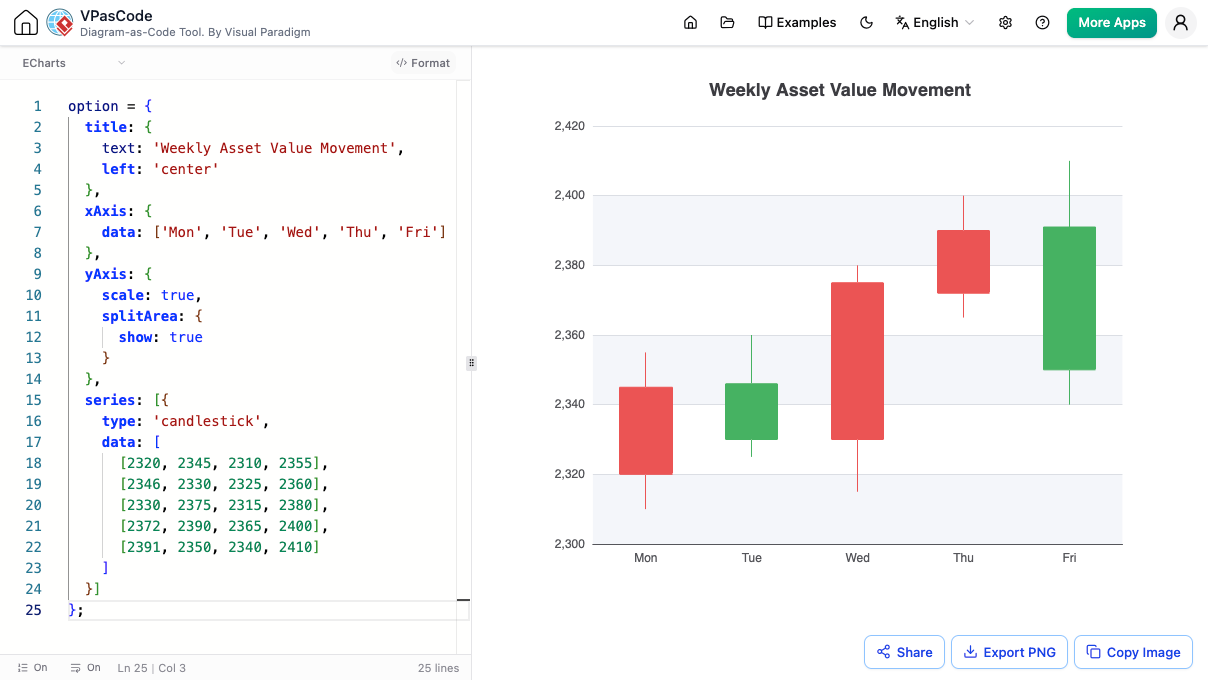
Candlestick Chart
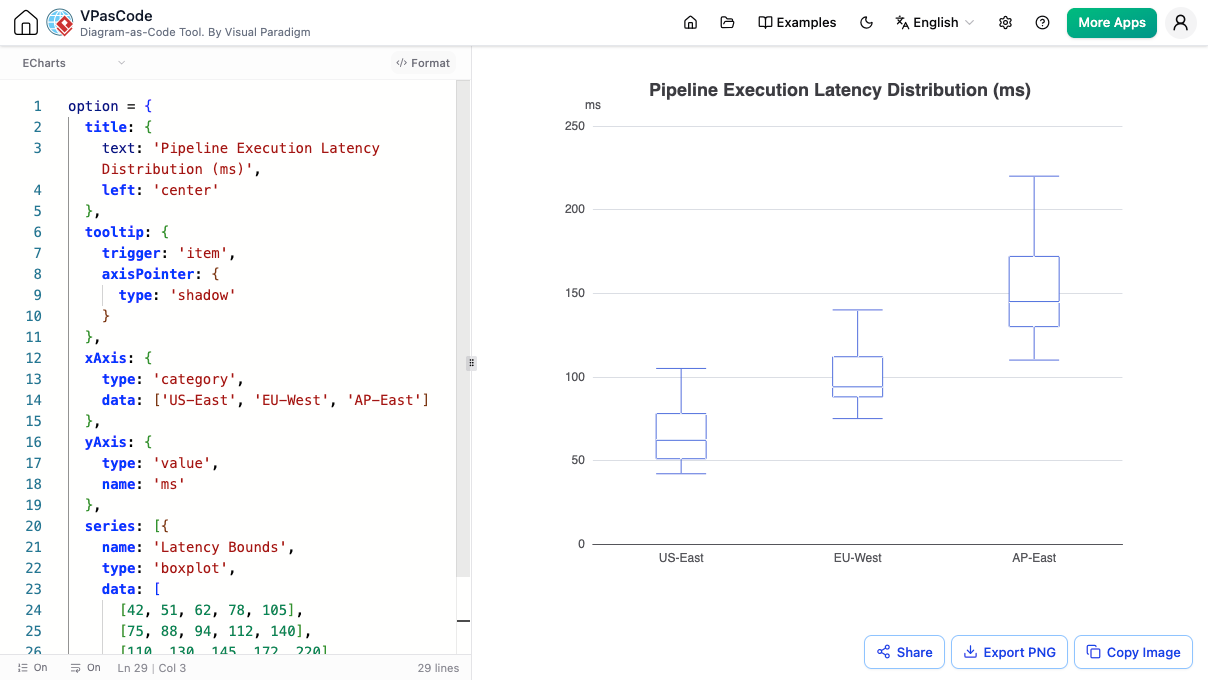
Boxplot Chart
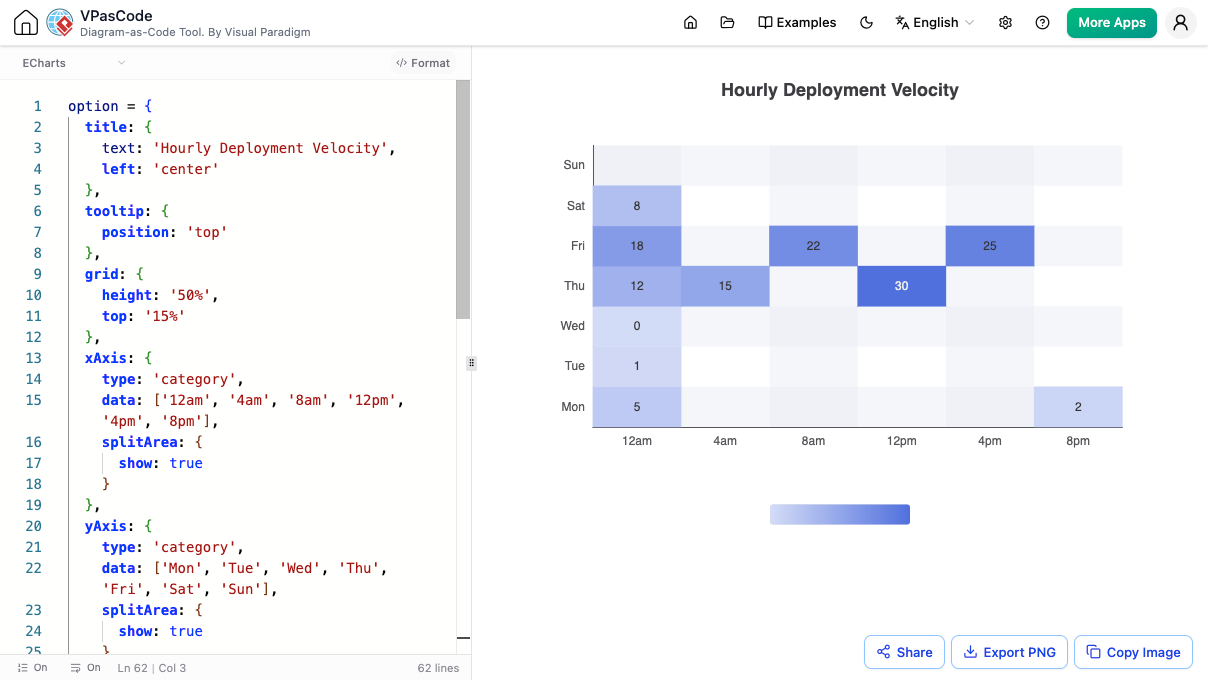
Heatmap Chart
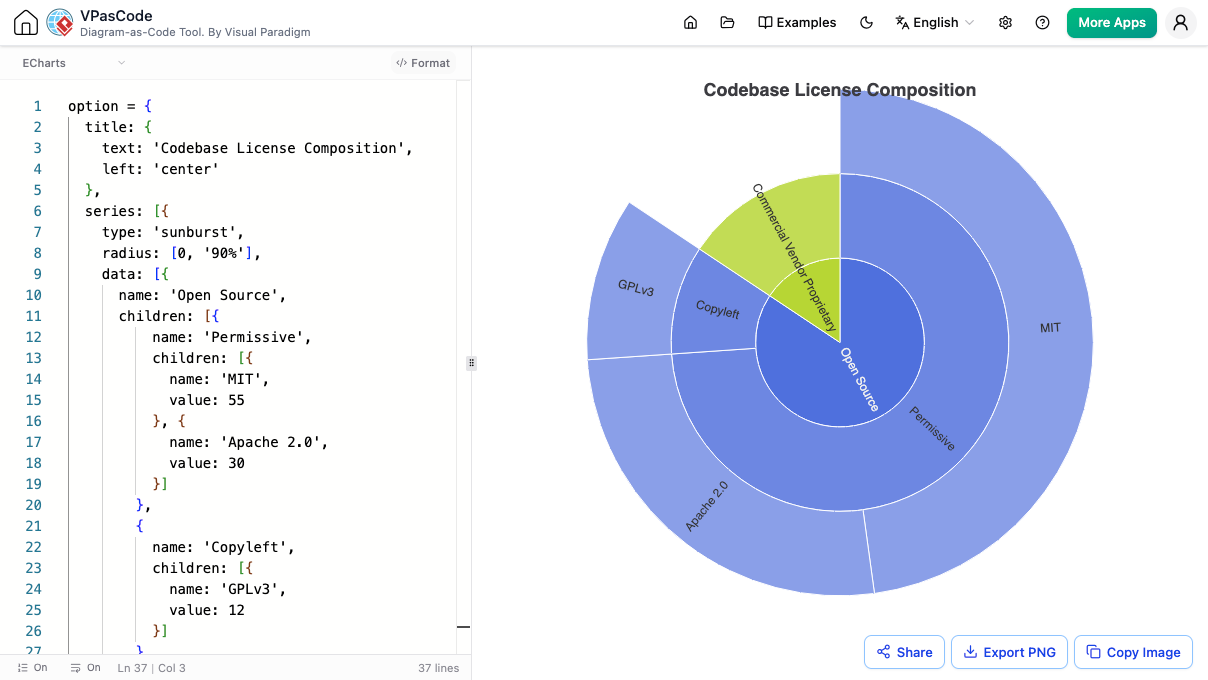
Sunburst Chart
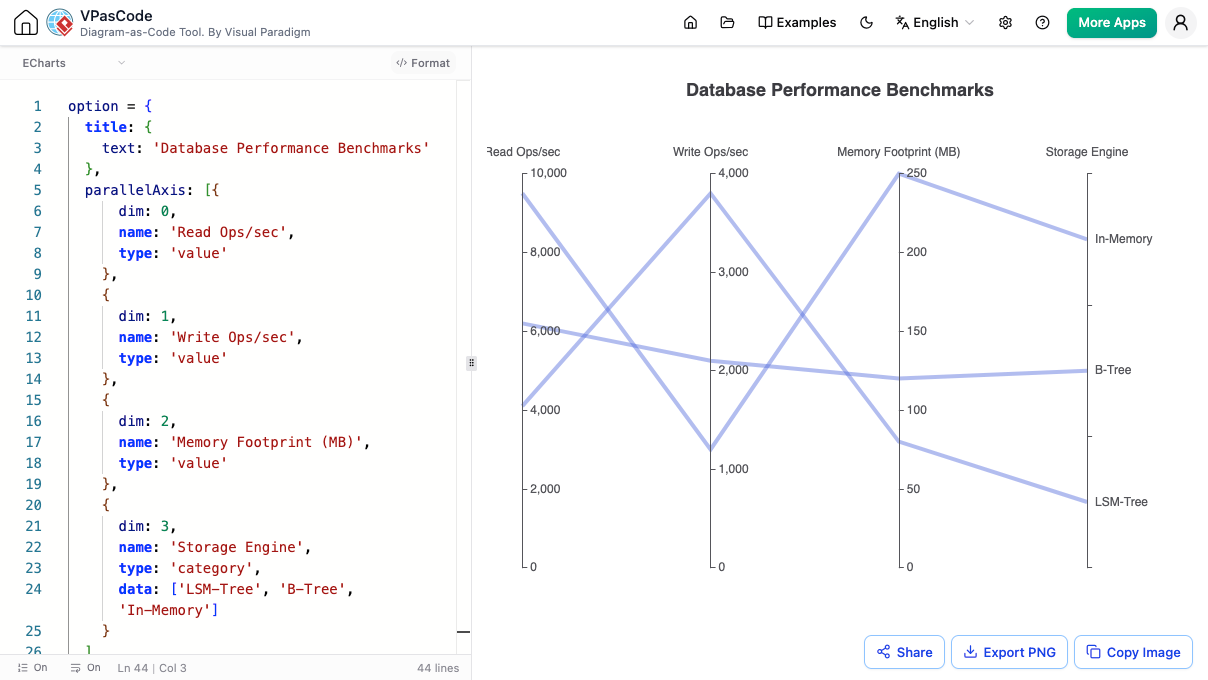
Parallel Chart
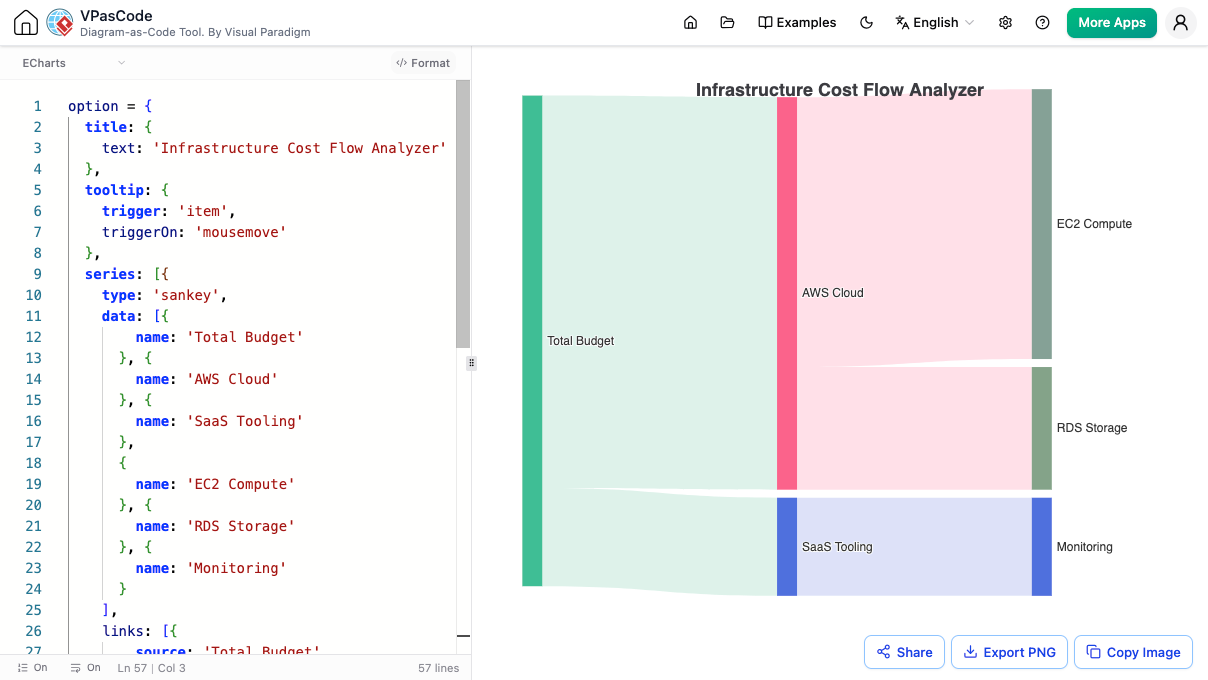
Sankey Chart
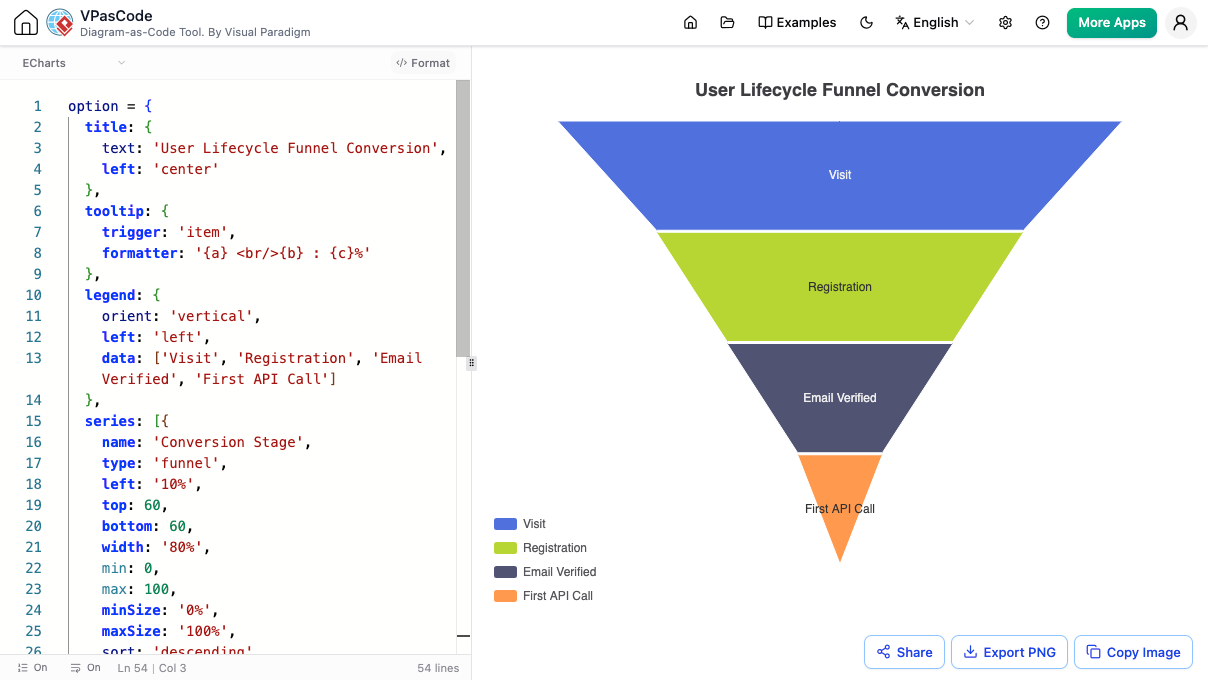
Funnel Chart
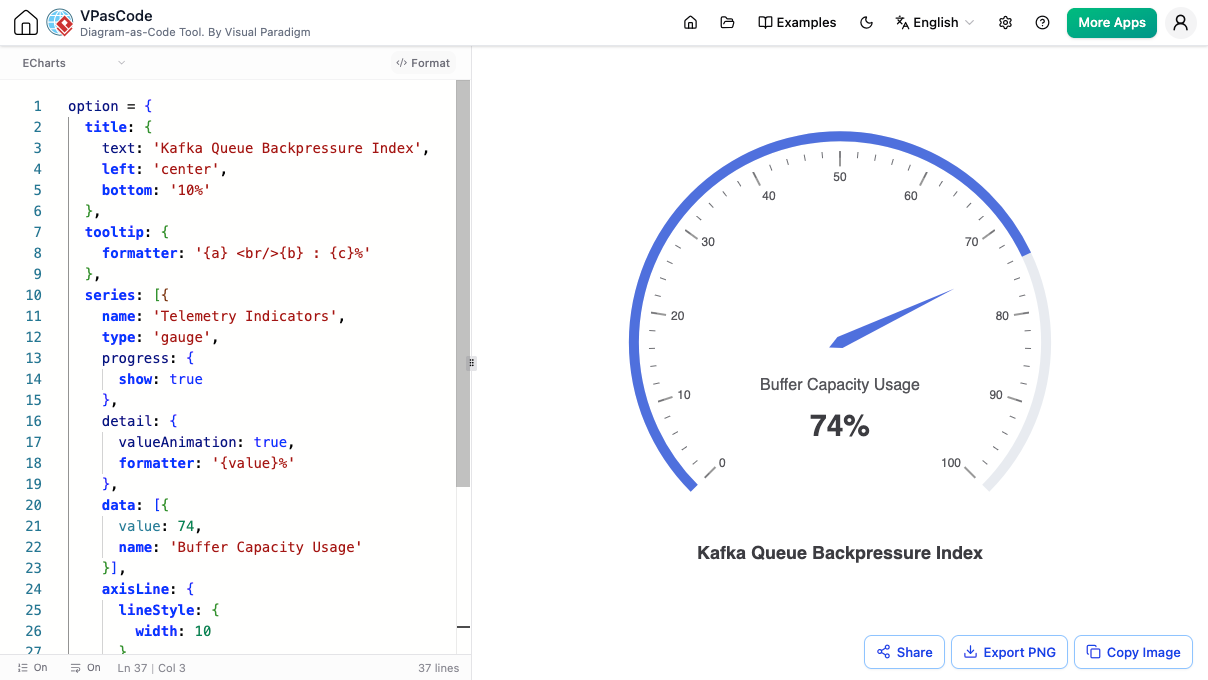
Gauge Chart
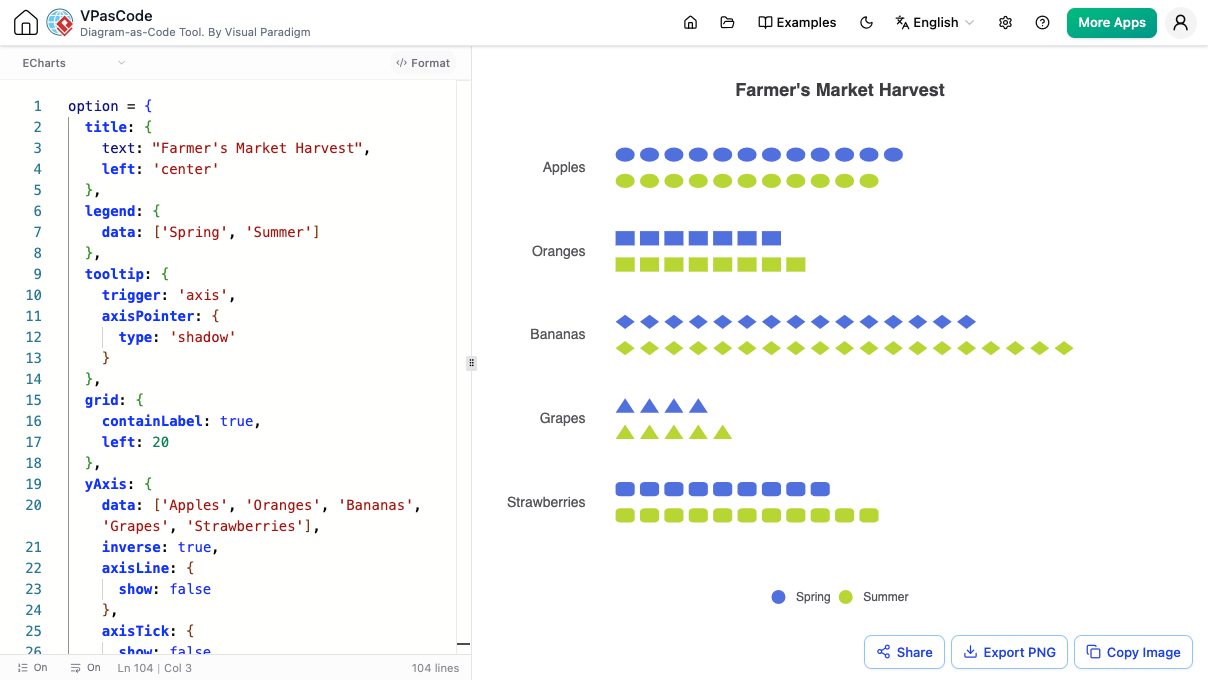
Pictorial Bar Chart
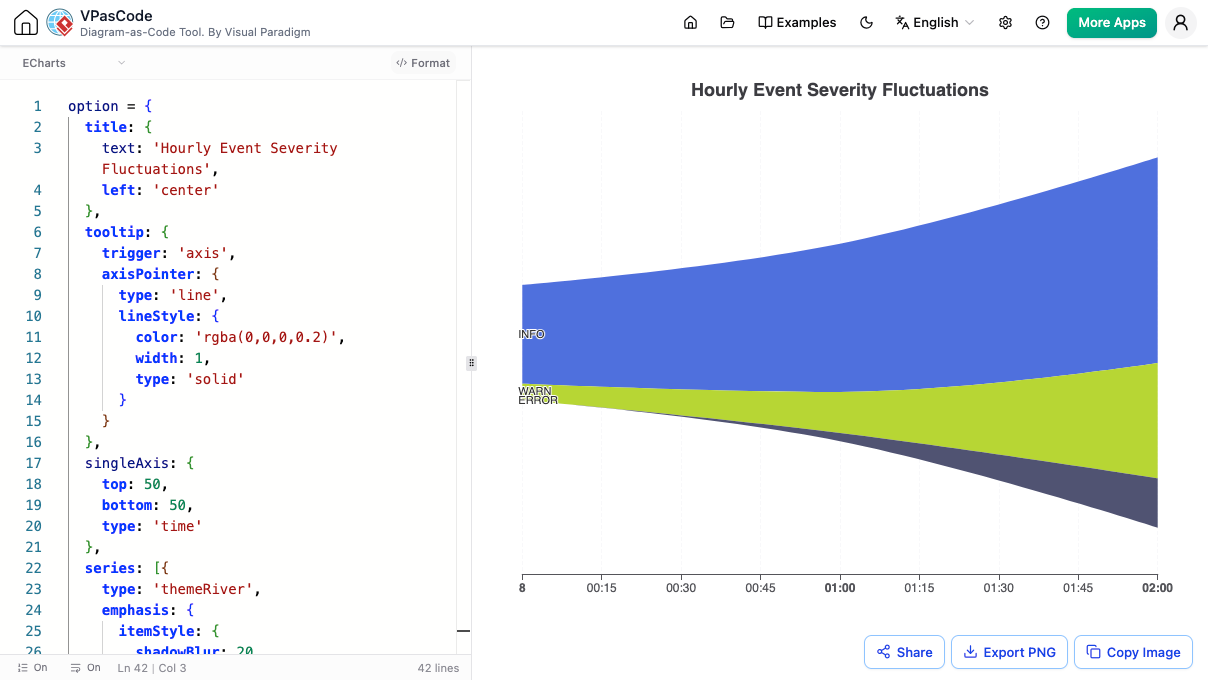
Theme River Chart

Keep Your Codes Organized with Auto-Formatting

VPasCode instantly structures complex code with standard indentations, making it highly readable and much faster to work with.

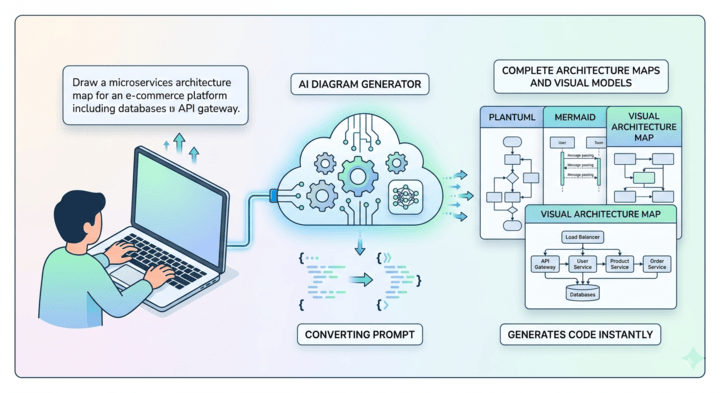
AI ECharts Code Generator

Transform raw data paths into fully formed visualization configurations. Quickly type in your idea for a chart layout, and let our intelligent AI ECharts generator output your starting dashboard blueprint.

An illustration portraying AI diagram generation in VPasCode, featuring a text prompt box and an AI Generate button to create diagram-as-code models automatically.

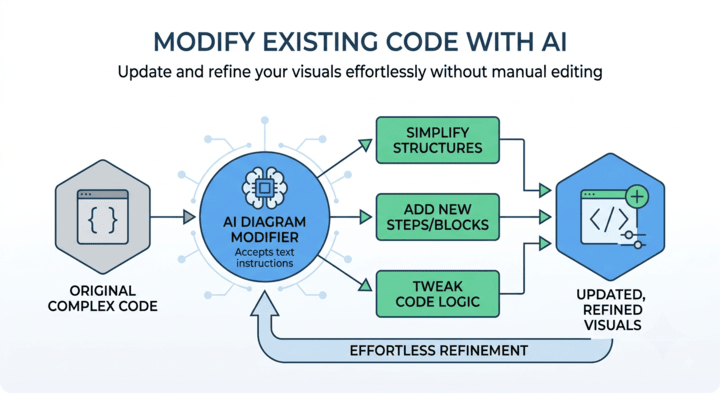
AI ECharts Config Modification

Evolve your data visuals seamlessly as requirements expand. Instruct the companion tool to inject new data arrays, alter series properties, or refactor your ECharts JSON script blocks safely.

An illustration portraying the VPasCode AI diagram editor modal, demonstrating how users can input text instructions to modify and update existing architecture maps.

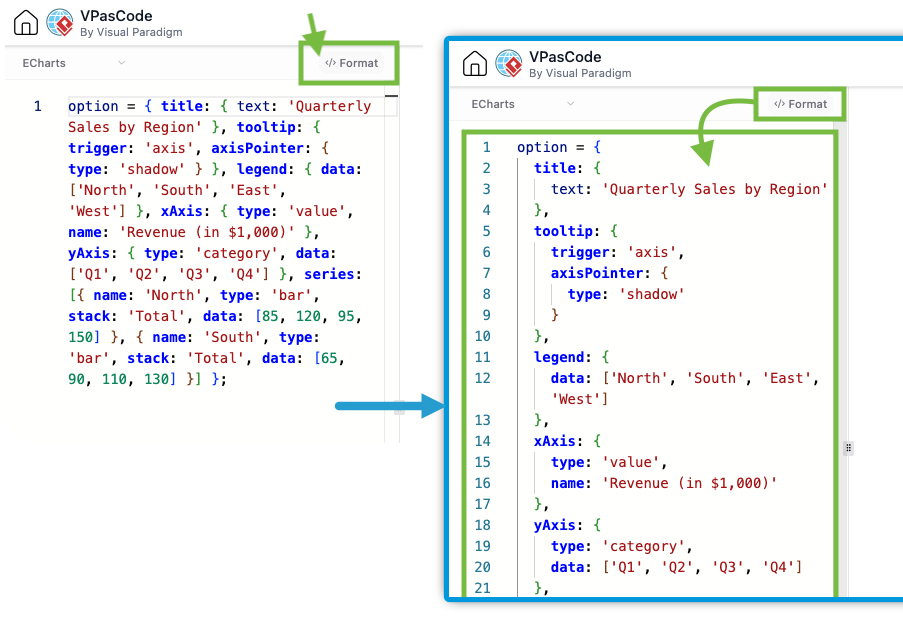
One-Click ECharts Code Formatting

When working with complex ECharts code, readability is everything. Squeezing multiple attributes into one packed line makes it easy to miss details or make editing mistakes.

With our built-in formatting tool, simply click the </> Format button at the top of the editor. VPasCode instantly organizes your script with clean, standard indentations, spreading attributes onto their own lines so your chart data and styling are effortless to find and update.

Click on Format button to quickly locate and update labels, series data, or styling rules without hunting through packed lines of code.

Convert to PDF, SVG, or PNG instantly

Get your charts into the exact format you need. Pick a PDF for formal reports, an SVG that stays sharp at any size, or a fast PNG image for quick chat messages.

Exporting PlantUML diagrams as vector PDF, SVG, or PNG files in VPasCode

A Fully-Equipped ECharts Tool

Use it instantly online

There are zero plugins or setups to worry about. Just open the page, paste your text, and start styling your charts.

Instant Sharing

Share your ECharts options and rendered charts via a direct URL or QR code.

Live Rendering

Our online ECharts editor shows your chart update in real-time as you configure options.

Automatic Detection

Paste any ECharts option code. Our ECharts tool recognizes it and renders the chart.

OpenDocs Integration

Send your finished chart to Visual Paradigm OpenDocs for documentation.

Also a Unified Tool

While it's a first-class ECharts editor, it also supports PlantUML, Mermaid, Graphviz, and more.

A Unified Platform for All Your Code-Based Diagrams

While VPasCode is a world-class ECharts tool, it's also a unified diagramming environment. The skills you learn are transferable. Effortlessly create diagrams with PlantUML, Mermaid, Graphviz, or visualize data from JSON and SQL—all in one place.

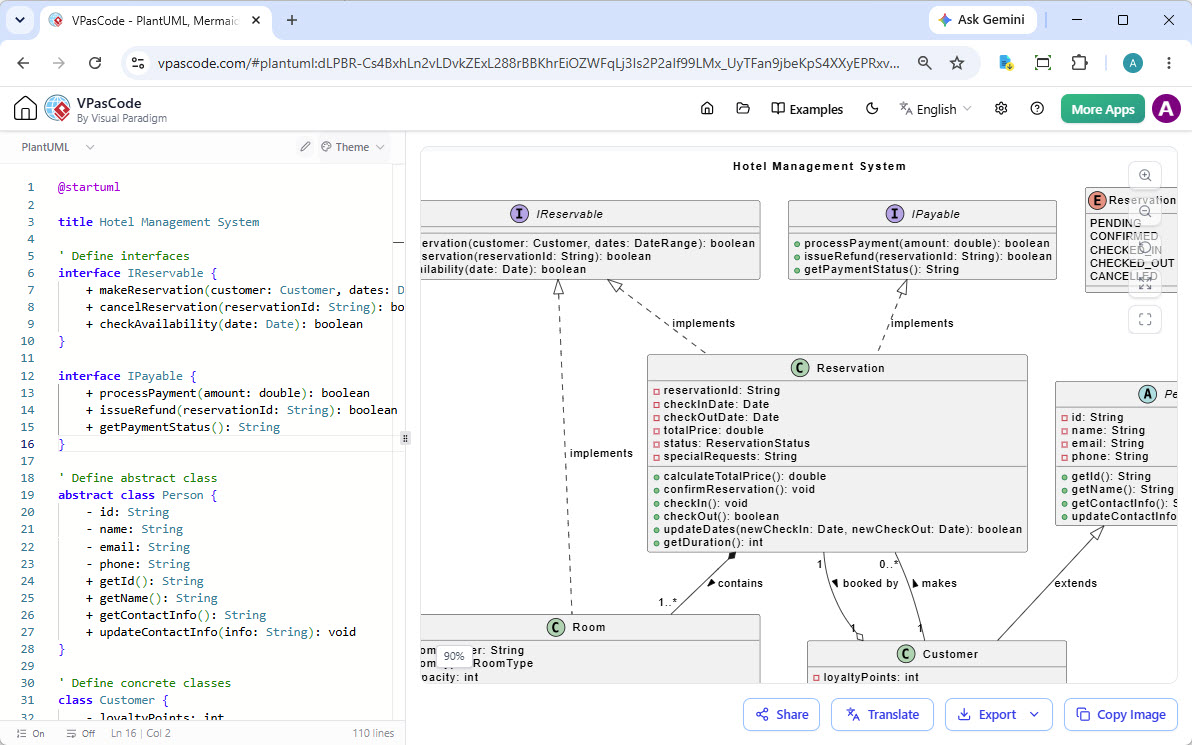
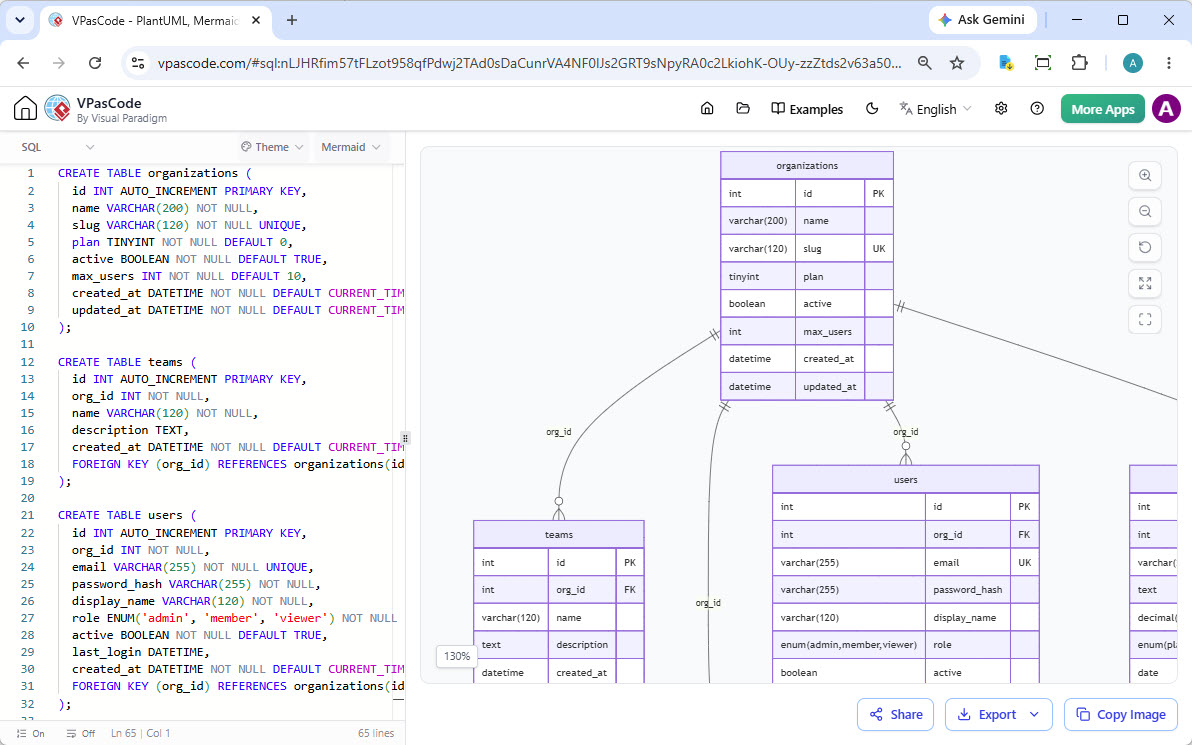
A PlantUML class diagram shown in the VPasCode editor.

PlantUML Support

Create UML, ArchiMate, C4 diagrams and more.

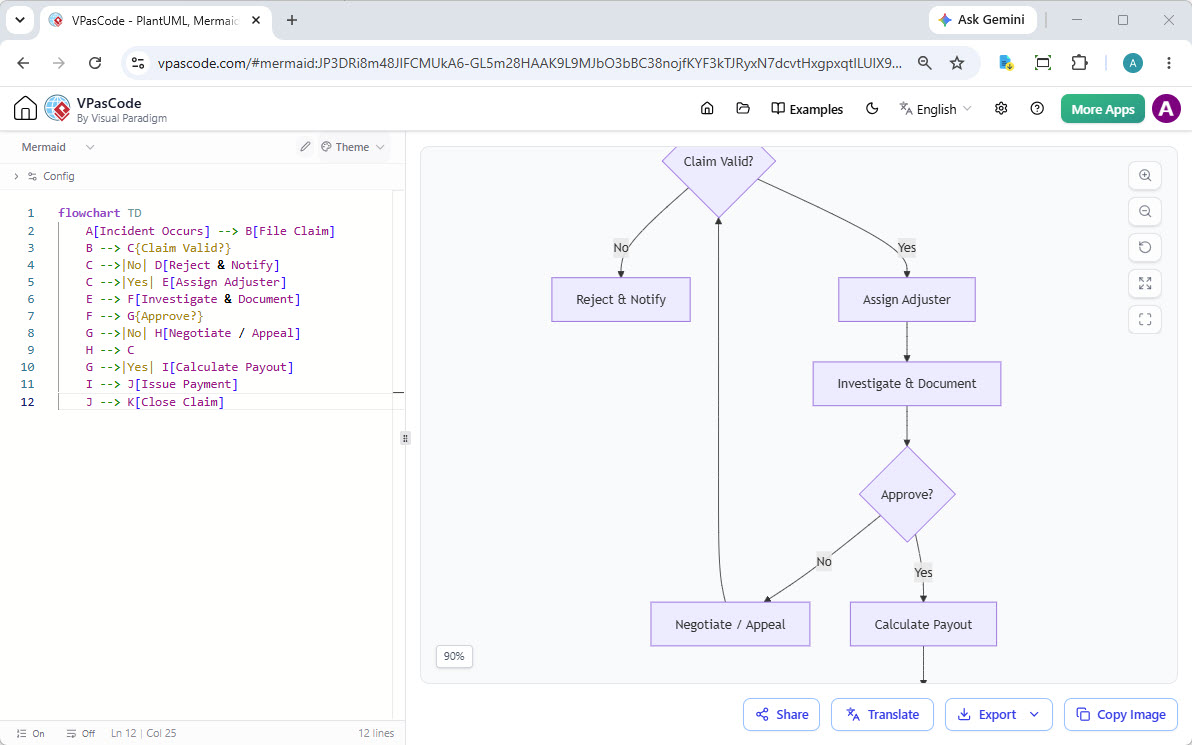
A Mermaid flowchart diagram shown in the VPasCode editor.

Mermaid Support

Create Flowcharts, Sequence diagrams, Gantt charts and more.

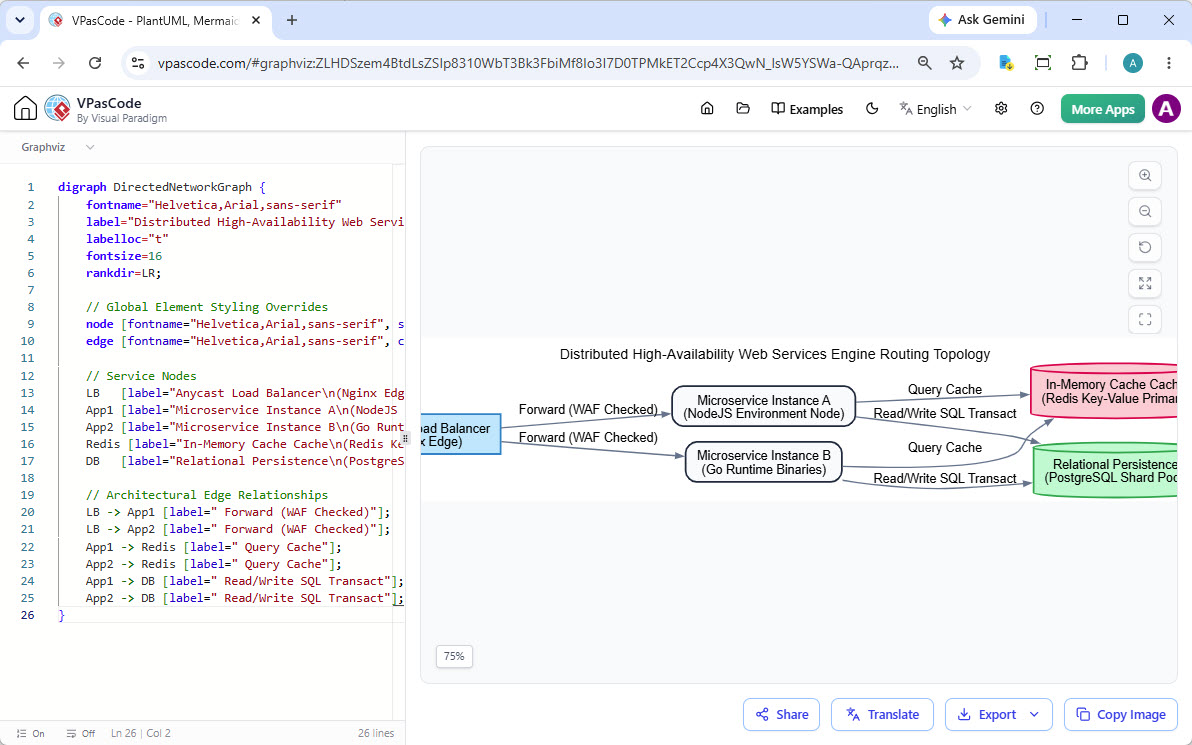
A Graphviz digraph shown in the VPasCode editor.

Graphviz DOT Support

Render complex graphs and network diagrams from DOT language.

SQL data being visualized in the VPasCode editor.

And Many More

Visualize SQL, JSON, YAML, Markmap mind maps and other formats.

Seamlessly Integrated with the Visual Paradigm Suite

Your ECharts editor is a key component of the Visual Paradigm ecosystem, ensuring a smooth workflow from initial concept to final documentation.

Generate with AI, Perfect with VPasCode

Use the Visual Paradigm AI Diagramming Chatbot to generate complex ECharts options from natural language prompts. Then, open the generated code in your ECharts editor to refine every last detail.

Try AI Diagramming Chatbot Now
Workflow from AI Chatbot to the VPasCode ECharts editor.
Diagram from your ECharts tool shown in OpenDocs.

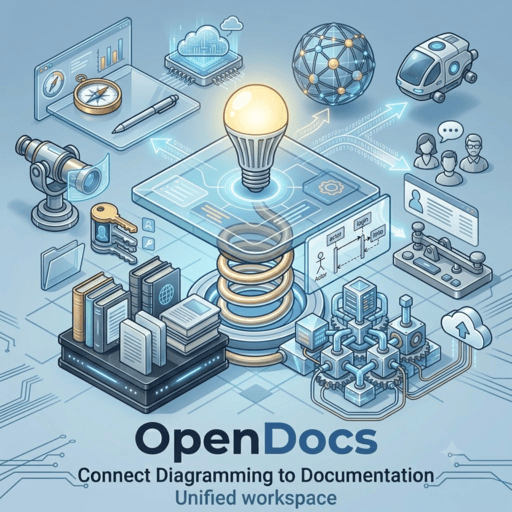
Connect Diagramming to Documentation

A chart is often part of a larger story. With one click, send your finished work from your ECharts tool directly to Visual Paradigm OpenDocs to create rich, shareable knowledge bases and project documentation.

Trusted by Leading Teams Worldwide

Our ECharts editor and wider modeling platform are used by professionals in the world's most successful companies.

Adobe logo
Apple logo
AT&T logo
Caterpillar logo
Intel logo
NASA logo
Nokia logo
Toyota logo

Ready to Elevate Your Data Visualizations?

Stop struggling with static charts. Start creating dynamic, interactive data visualizations today with the best free ECharts editor on the web. No complex setups required.

Your ECharts Editor Questions, Answered

What is an ECharts editor?

An ECharts editor is a specialized tool for writing ECharts options (usually in JSON) to define interactive data visualizations. The VPasCode ECharts editor provides a live, real-time preview of your charts as you configure them, streamlining the design process significantly.

Is this a free ECharts editor?

Yes, our core ECharts editor functionality is completely free. You can design, edit, live-preview, and export your charts to SVG/PNG without any cost.

Does Visual Paradigm VPasCode support AI chart generation?

Yes! VPasCode features built-in, native AI chart generation directly inside the editor.
Simply enter a natural language prompt—such as "Generate a monthly sales bar chart in ECharts" or "Create a pie chart showing market share breakdown"—and VPasCode will instantly write the ECharts JSON configuration and render the chart natively.

Can I edit a chart generated with the Visual Paradigm AI Diagramming Chatbot inside VPasCode?

Yes! You can generate initial chart concepts using the standalone Visual Paradigm AI Diagramming Chatbot, and then click "Open in VPasCode" to push the generated ECharts configuration into the editor. From there, you can freely update the underlying dataset, adjust axis parameters, change color schemes, or tweak interactivity options on demand.

What kind of charts can I create with ECharts?

ECharts is incredibly versatile, supporting a vast array of chart types including line charts, bar charts, pie charts, scatter plots, treemaps, heatmaps, and various statistical charts. Our ECharts tool leverages this full capability to let you visualize almost any data set.

How does ECharts compare to other charting libraries?

ECharts stands out for its rich set of interactive features, powerful rendering capabilities, and extensive documentation, making it suitable for complex and enterprise-level data visualization. While other libraries exist, our ECharts editor makes it exceptionally easy to harness its full potential for stunning, performant charts.