Visualize Complex Networks with Our Free Graphviz Editor
Bring your data structures and network diagrams to life with our premier Graphviz tool. VPasCode is an intelligent online Graphviz editor that renders DOT language in real-time, helping you build and understand complex graphs effortlessly.
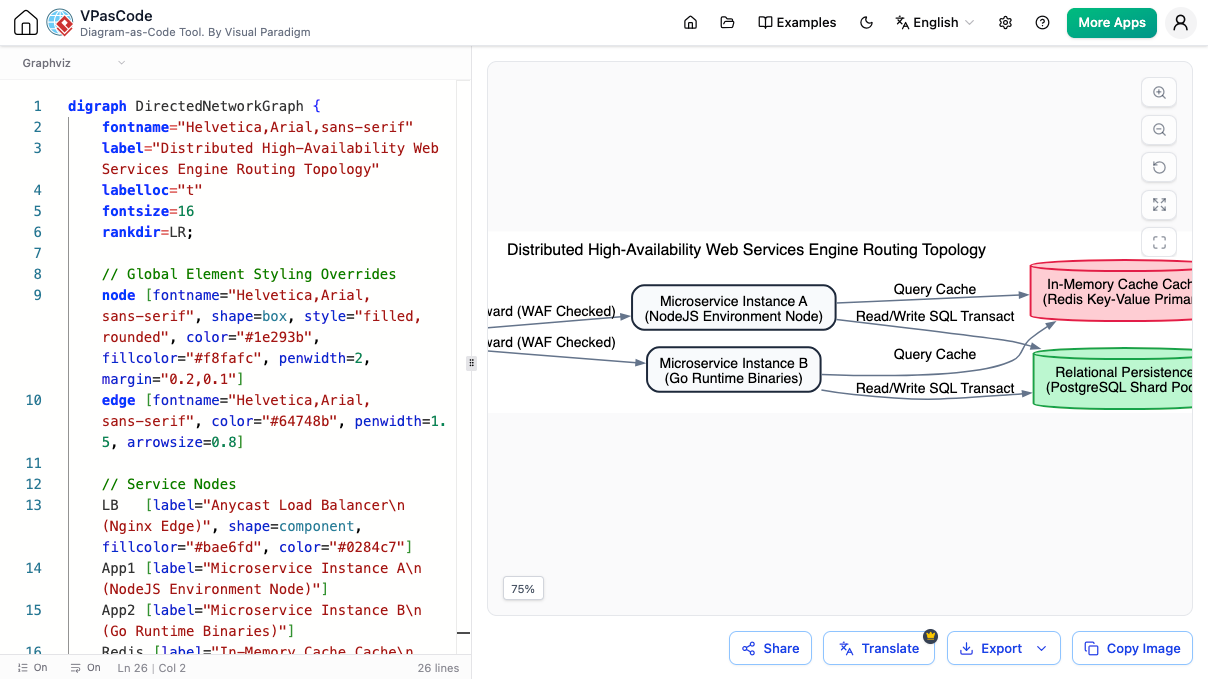
Tired of Writing Blind DOT Language?
Writing DOT syntax without immediate visual feedback is slow and error-prone. You need a dedicated Graphviz editor that shows you the result as you type and helps you master the syntax, rather than just a plain text editor and a separate command-line tool.
A Real-Time Graphviz Playground
Our Graphviz tool is built for exploration and speed. Write DOT language and see your directed and undirected graphs appear instantly. There's no better way to learn, build, and debug your Graphviz creations.
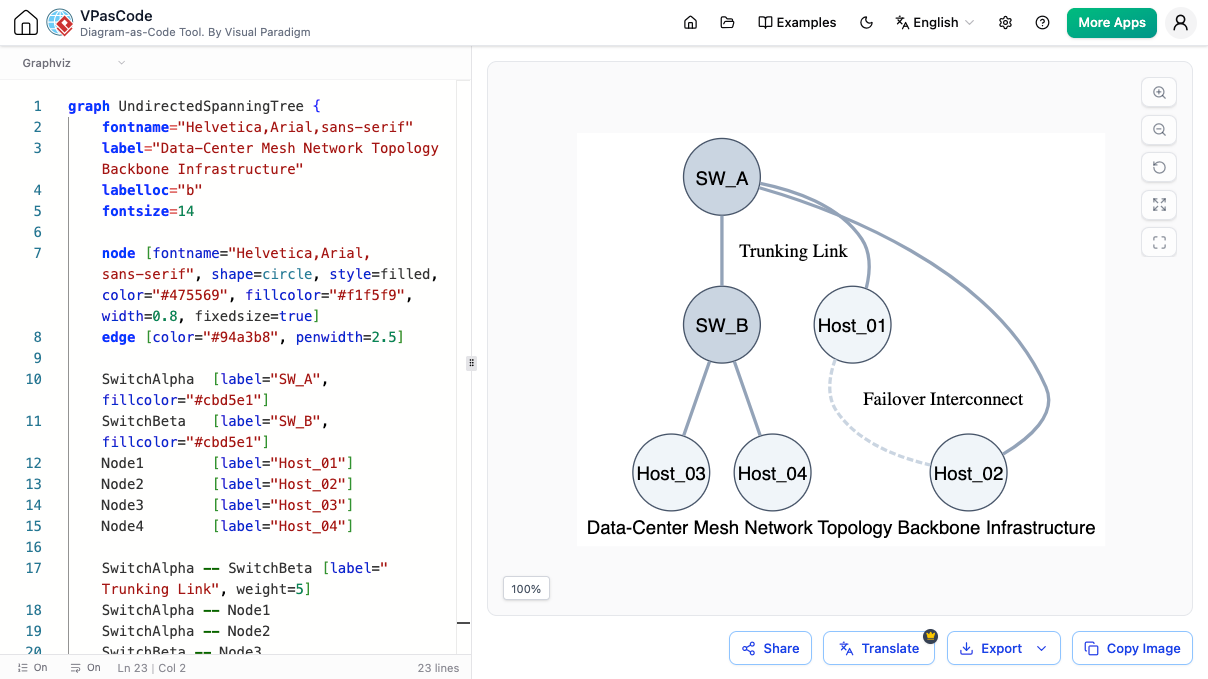
A directed graph rendered from DOT language in our Graphviz editor.
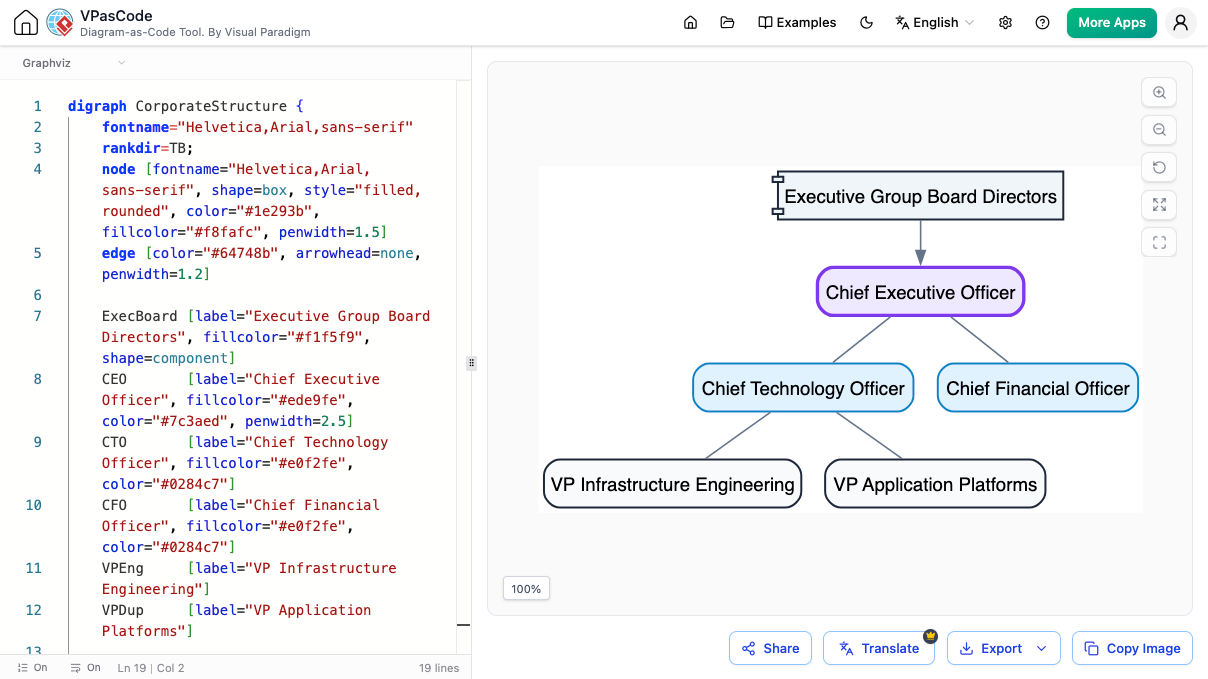
An AI-Enhanced Graphviz Tool
VPasCode accelerates your workflow by integrating AI directly into the Graphviz editor.
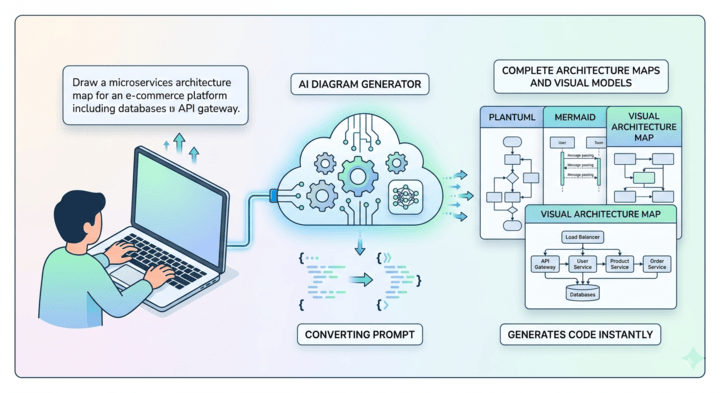
AI Graphviz DOT Generator
Kickstart your next complex network graph instantly. Simply type in your concept, and watch the system construct completely valid Graphviz DOT syntax right before your eyes.
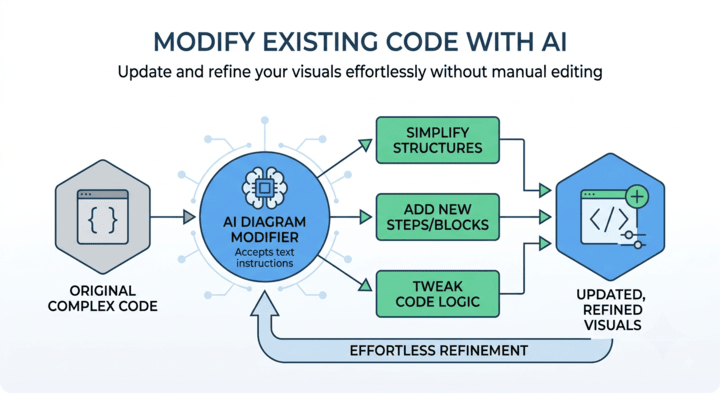
AI Graphviz Layout Modification
Restructuring complex data graphs doesn't require script rewrites. Use smart layout commands to effortlessly swap nodes, invert dependencies, or simplify complex nested Graphviz script code.
Correct DOT Language Errors with AI
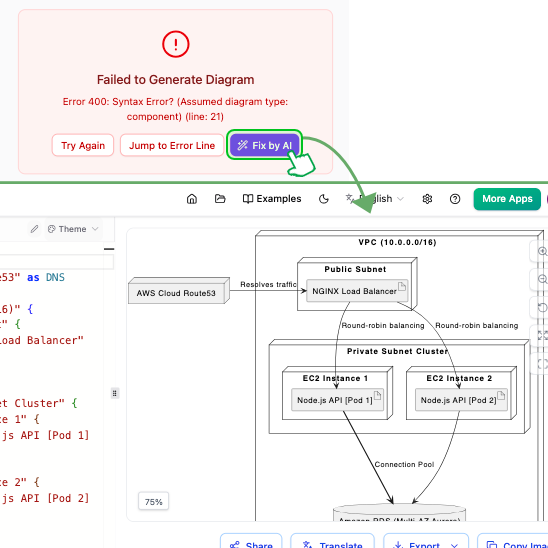
A syntax error in your DOT file can be hard to spot. Our Graphviz editor provides one-click AI Code Error Fixing to instantly resolve issues and get your graph rendering correctly.
The AI also explains the fix, helping you learn the nuances of the DOT language. It's the most intelligent free Graphviz editor for mastering graph visualization.
Translate Graph Labels with AI
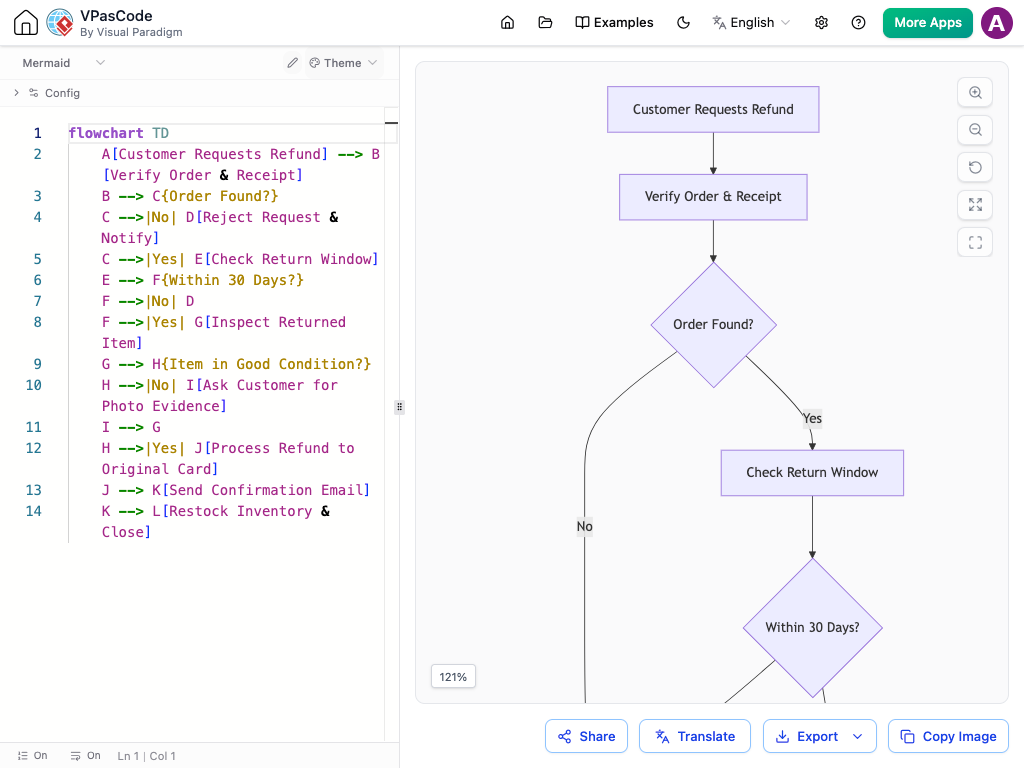
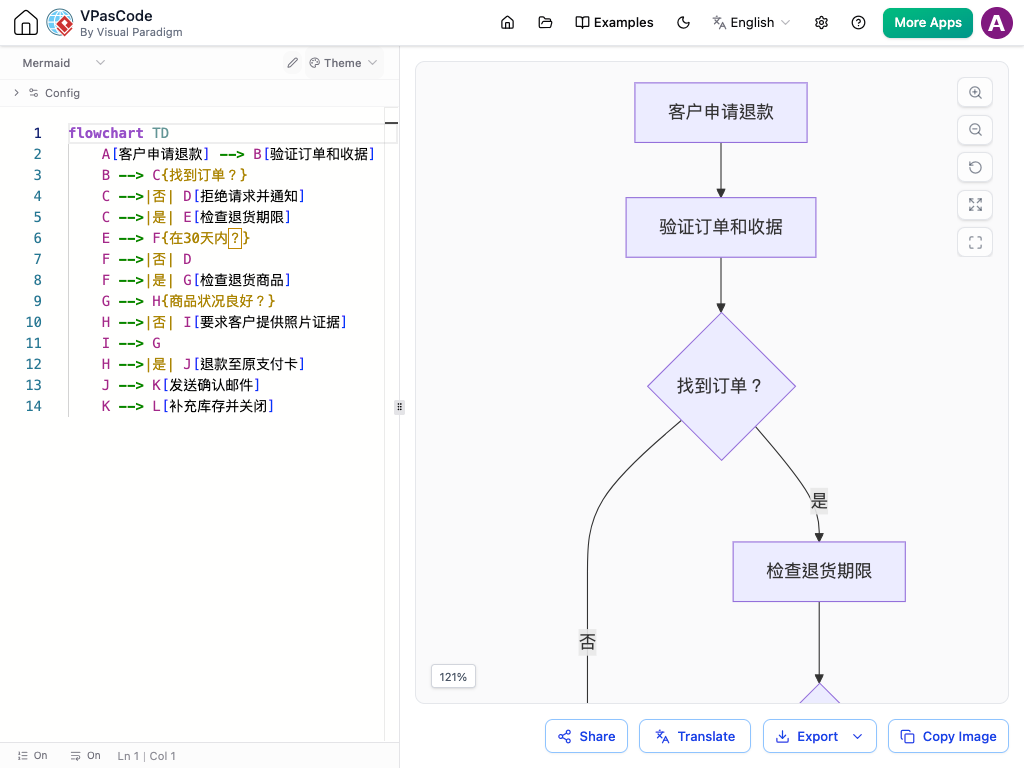
Need to share your graphs with an international audience? Use the AI Diagram Translation feature in our Graphviz editor to instantly convert all text labels to other languages, making your visualizations universally understandable.
Custom AI Endpoint Integration
Direct your AI operations through your preferred providers using your own corporate API keys. This gives your team full authority over privacy governance, security standards, and API budget limits.
Easily configure custom endpoints to connect with major models from OpenAI, Anthropic, Google, DeepSeek, Mistral, Qwen, Groq, and more.

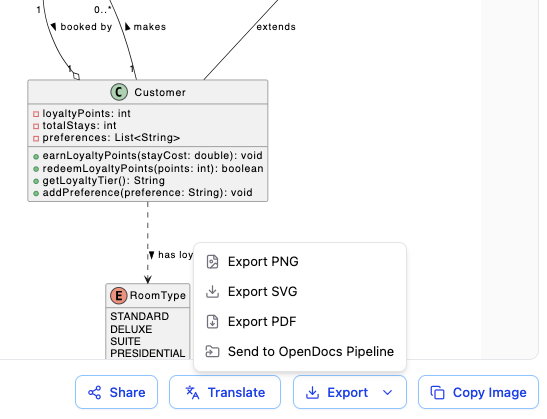
Export as Vector PDF, SVG, or PNG
Easily convert your PlantUML code into production-ready files. Download your diagrams as high-quality PDFs for formal reports and print, scalable SVGs for technical documentation, or crisp PNGs for quick team chat sharing.
A Fully-Equipped Graphviz Tool
Runs entirely in your browser
Skip the installations because this tool runs right on the web. Simply paste your diagram code to view and change it.
Instant Sharing
Share your DOT code and rendered graphs via a direct URL or QR code.
Live DOT Rendering
Our online Graphviz editor shows your graph update in real-time as you type.
Automatic Detection
Paste any code. Our Graphviz tool recognizes DOT language and renders it.
OpenDocs Integration
Send your finished graph to Visual Paradigm OpenDocs for documentation.
Also a Unified Tool
While it's a first-class Graphviz editor, it also supports PlantUML, Mermaid, and more.
A Unified Platform for All Your Code-Based Diagrams
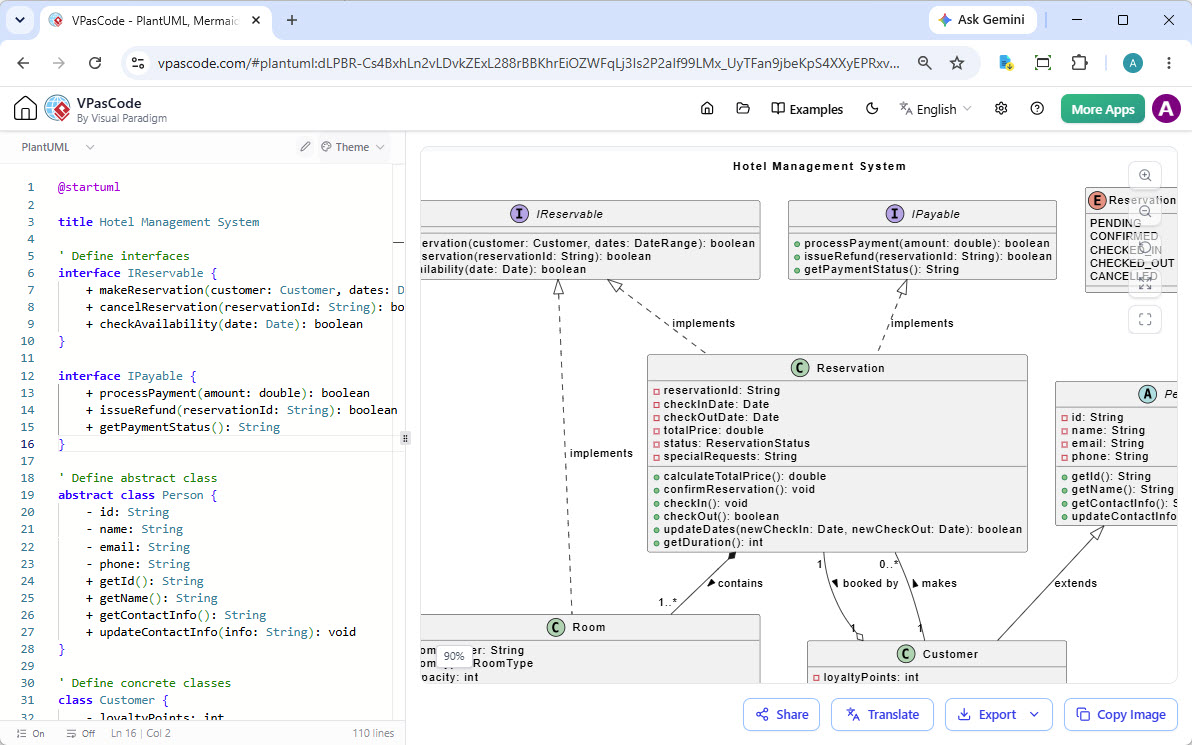
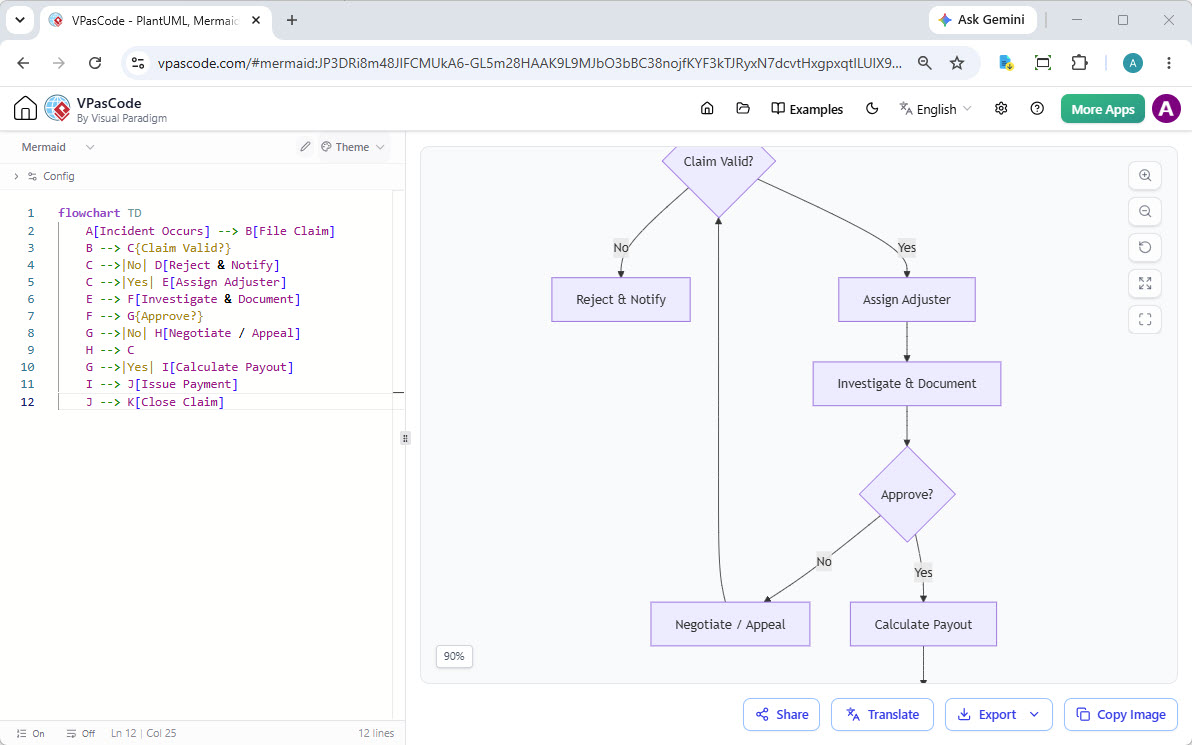
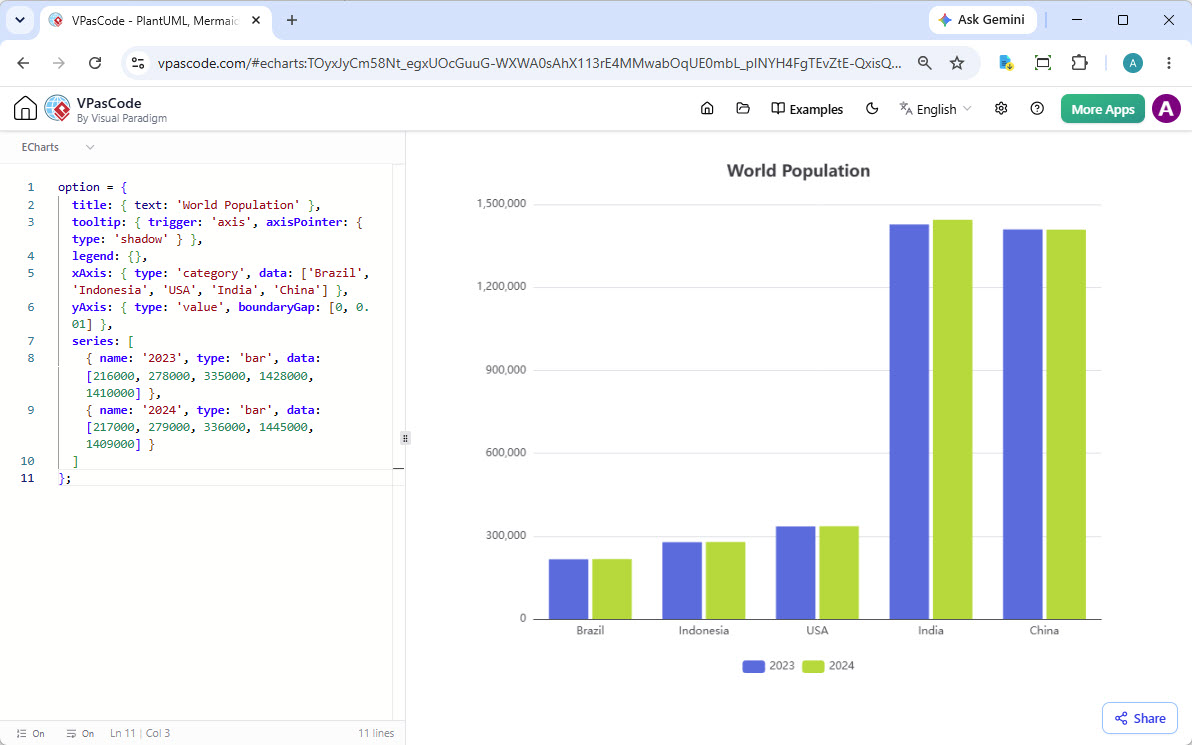
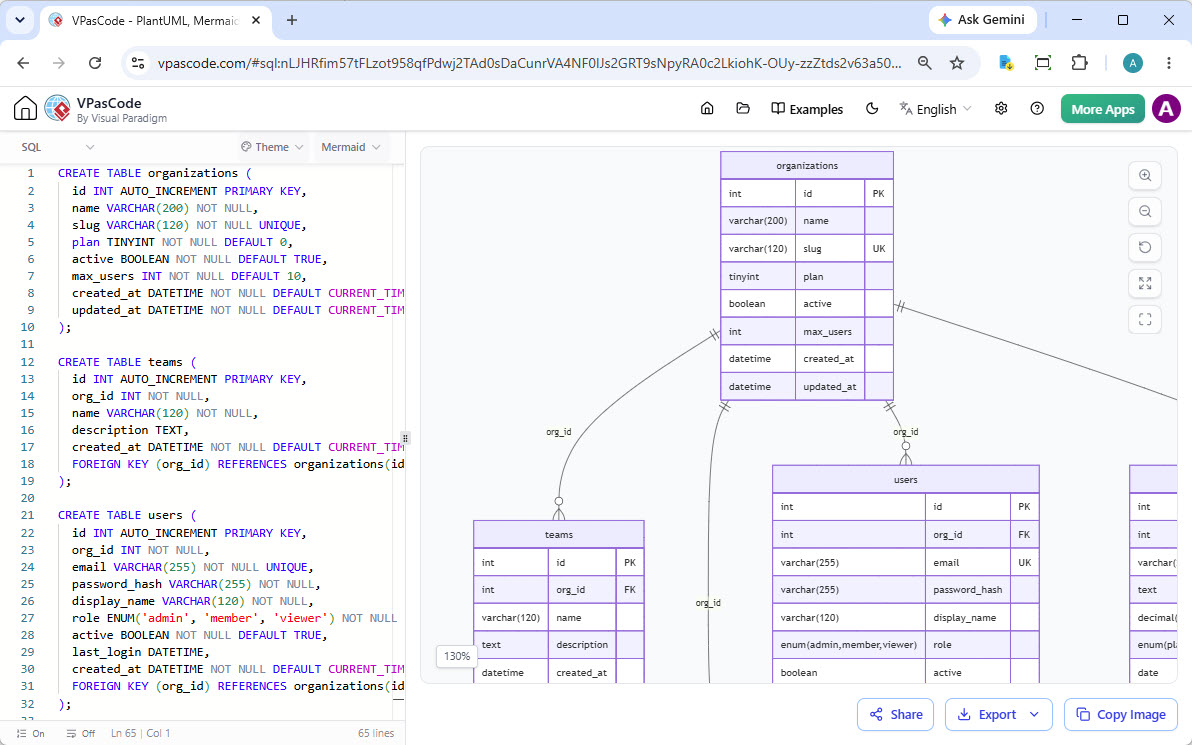
While VPasCode is a world-class Graphviz tool, it's also a unified diagramming environment. The skills you learn are transferable. Effortlessly create diagrams with PlantUML, Mermaid, ECharts, or visualize data from JSON and SQL—all in one place.
And Many More
Visualize SQL, JSON, YAML, Markmap mind maps and other formats.
Seamlessly Integrated with the Visual Paradigm Suite
Your Graphviz editor is a key component of the Visual Paradigm ecosystem, ensuring a smooth workflow from initial concept to final documentation.
Generate with AI, Perfect with VPasCode
Use the Visual Paradigm AI Diagramming Chatbot to generate complex Graphviz diagrams from plain text. Then, open the generated DOT code in your Graphviz editor to refine every last detail.
Try AI Diagramming Chatbot Now
Connect Diagramming to Documentation
A diagram is often part of a larger story. With one click, send your finished work from your Graphviz tool directly to Visual Paradigm OpenDocs to create rich, shareable knowledge bases and project documentation.
Trusted by Leading Teams Worldwide
Our Graphviz editor and wider modeling platform are used by professionals in the world's most successful companies.







Ready to Master Your Graph Layouts?
Stop compiling DOT code manually. Start visualizing your graphs instantly with the best free Graphviz editor on the web. No downloads required.
Your Graphviz Editor Questions, Answered
What is a Graphviz editor?
A Graphviz editor is a tool for writing DOT language scripts and seeing them rendered as graphs. The VPasCode Graphviz editor is a real-time tool that instantly visualizes your DOT code, making it easy to create and debug complex network diagrams, organization charts, data structures, and other abstract graphs.
Does Visual Paradigm VPasCode support AI diagram generation?
Yes! VPasCode features built-in, native AI diagram generation.
Simply enter a natural language prompt—such as "Generate a network topology graph in Graphviz" or "Create a dependency tree using DOT language"—and VPasCode will instantly write the code and render the graph natively inside the editor.
Can I edit AI Chatbot diagrams in VPasCode?
Yes! You can generate initial graph concepts using the standalone Visual Paradigm AI Diagramming Chatbot, and then open those DOT scripts directly inside VPasCode to perform further code editing, fine-tune node attributes, or translate text labels.
Is this a free Graphviz editor?
Yes, all core diagramming features of our Graphviz editor are free. This includes the live-rendering editor for DOT language and exporting to SVG/PNG. Advanced features like AI syntax correction are available in our premium editions.
What is the DOT language?
DOT is a graph description language used by Graphviz. It allows you to define a graph's structure and attributes in a simple text format. For example, 'digraph G { A -> B }' describes a simple directed graph where node A points to node B. Our Graphviz tool is designed to render this language.
When should I use Graphviz over other tools?
Graphviz excels at automatically laying out complex, abstract graphs and network diagrams. While tools like Mermaid or PlantUML are often better for structured diagrams like flowcharts or sequence diagrams, the automatic layout algorithms of this Graphviz tool are superior for visualizing complex relationships, dependencies, and network topologies.
How can I export or share my Graphviz diagrams?
You can export your rendered graphs as PDF documents, vector files (SVG) for crisp scaling, or high-resolution images (PNG). You can also generate a direct web link to share your live graph, or copy the bitmap straight to your clipboard to paste into documents and presentations.