A practical, step-by-step guide for architects and developers to evolve software architecture documentation using Visual Paradigm — comparing traditional modeling with AI-powered acceleration.
You've been there before: a new developer joins the team and spends weeks trying to understand how the system actually works. A critical bug surfaces, and the team struggles to trace where responsibilities lie across services. A stakeholder asks, "Where is the authentication logic handled?" and no one can give a clear, visual answer.
The problem isn't a lack of documentation—it's documentation that lives at the wrong level of abstraction.
High-level context diagrams are great for executives, but they don't help developers navigate code. Detailed class diagrams are precise, but they overwhelm stakeholders and obscure the big picture. What's missing is the middle layer: the component-level view that bridges strategic architecture with tactical implementation.
That's where the C4 Model's Component Diagram (Level 3) comes in—and where Visual Paradigm becomes your secret weapon.
This comprehensive tutorial shows you exactly how to:
✅ Understand when and why to drill down from Container (L2) to Component (L3) diagrams
✅ Prepare your Container diagram as a solid foundation for decomposition
✅ Execute the drill-down workflow in Visual Paradigm using three distinct methods: traditional, manual, and AI-powered
✅ Compare modeling approaches to choose the right tool for your team and context
✅ Apply best practices that keep diagrams valuable, maintainable, and team-aligned
✅ Learn from a complete, real-world example: an Online Banking API Application—with full PlantUML code you can reuse
Whether you're a software architect designing a new system, a tech lead onboarding a distributed team, or a developer advocating for better documentation practices, this guide gives you the practical steps, tooling insights, and decision frameworks to make architecture visible, communicable, and actionable.
💡 No theory without practice: Every concept is paired with concrete Visual Paradigm workflows, AI prompt examples, and copy-paste-ready PlantUML snippets.
Let's turn architectural ambiguity into architectural clarity—starting with the container that matters most to your system today.
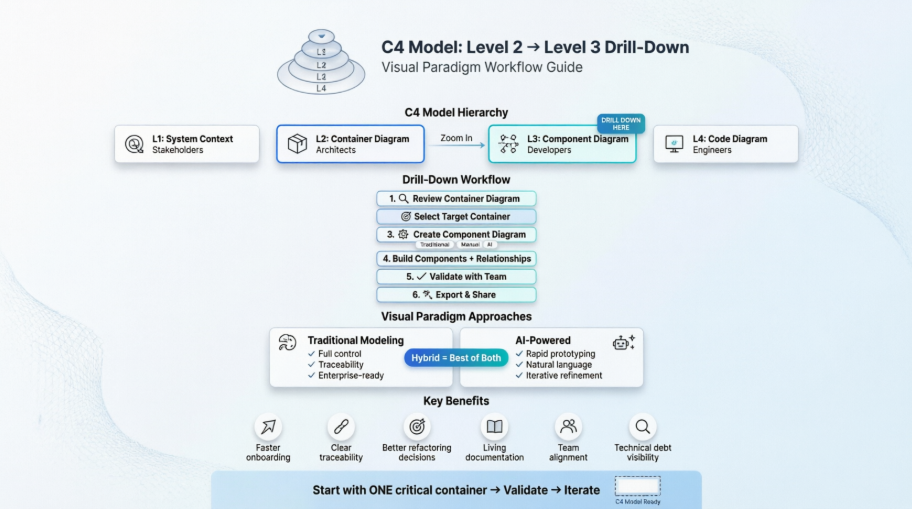
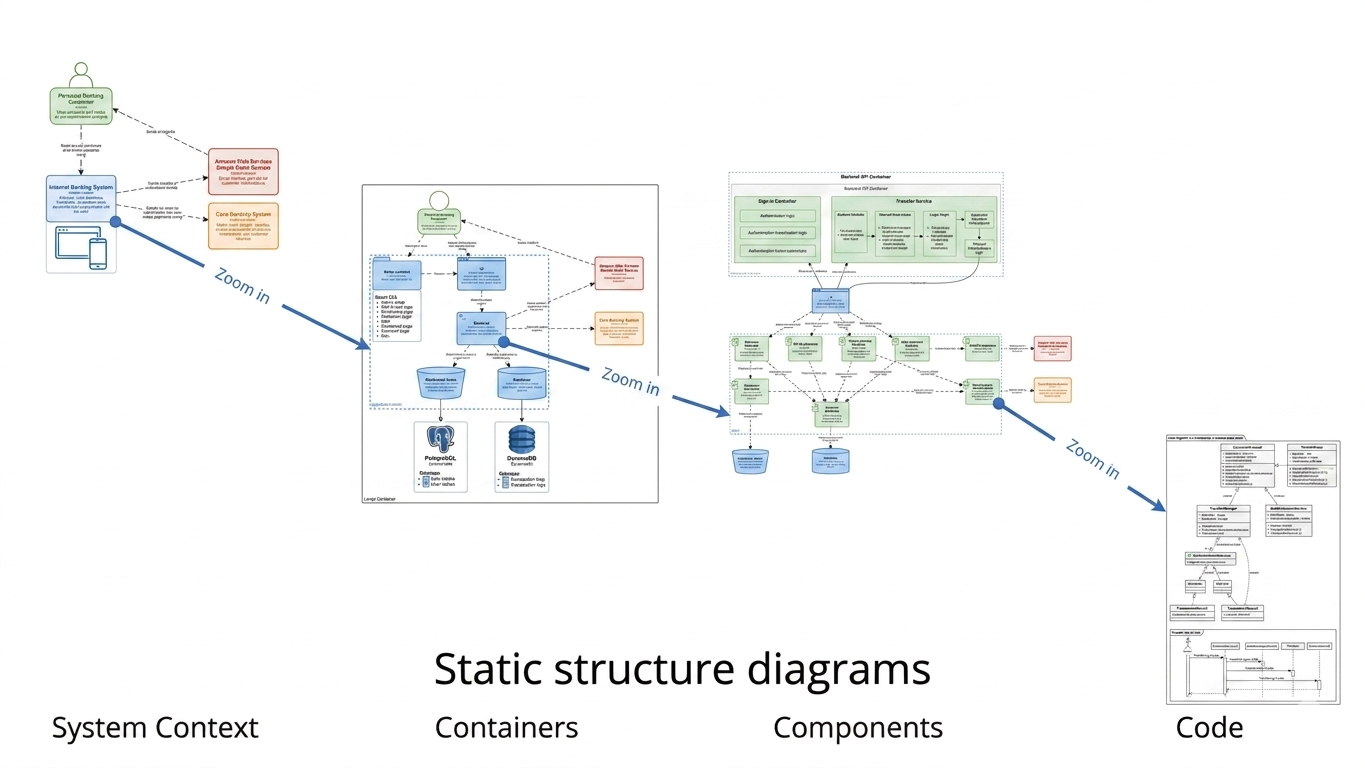
The C4 model (by Simon Brown) provides a layered approach to visualizing software architecture:
| Level | Name | Audience | Purpose |
|---|---|---|---|
| L1 | System Context | Business stakeholders, non-technical teams | Show system boundaries and external dependencies |
| L2 | Container Diagram | Architects, tech leads, DevOps | Show deployable units, technology choices, and high-level interactions |
| L3 | Component Diagram | Developers, architects, reviewers | Reveal internal structure of one container — major building blocks and responsibilities |
| L4 | Code/Class Diagram | Developers | Detailed implementation (optional, often auto-generated) |
🎯 Key Insight: Component diagrams (L3) zoom into one container at a time. They are not full class diagrams — focus on significant, reusable components with clear responsibilities.
💡 Rule of Thumb: Start with your most business-critical or technically complex container. One well-crafted component diagram delivers more value than five shallow ones.
Before drilling down, ensure your Container Diagram (L2) is clear and complete:
• Where is authentication/authorization handled?
• Where does core business logic live?
• How is data persisted or retrieved?
• Are there async processes or event publishers?
• Which components are stable vs. likely to change?
📝 Pro Tip: Document architectural decisions in element properties or link to Architecture Decision Records (ADRs) for traceability.
✅ Best for: Maintaining hierarchy, traceability, and consistency across levels.
Component - [Container Name]✅ Best for: Custom layouts, advanced styling, or when AI isn't available.
Create a C4 Component diagram for the 'API Application' container
(Java + Spring Boot). Include:
- Banking Controller (Spring REST Controller)
- Account Service, Transaction Service (Spring @Service)
- Customer Repository (Spring Data JPA)
- Notification Gateway (Java HTTP Client)
- Domain Model (Java entities)
Show: internal method calls, REST interactions with Web App,
JDBC access to Database. Add responsibilities and technologies.
✅ Best for: Rapid prototyping, brainstorming, or teams new to C4 modeling.
For each component, define:
Calls via internal methodPublishes event toReads from / Writes toValidates usinggRPC, JPA, Async RESTWeb App → Banking Controller: POST /api/accounts (JSON/HTTPS)| Feature | Traditional Modeling | AI-Powered Modeling |
|---|---|---|
| Speed | Manual, deliberate (30–90 mins) | Rapid prototyping (5–15 mins) |
| Control | Full control over every element | Requires prompt engineering & refinement |
| Learning Curve | Steeper (requires C4 + VP knowledge) | Lower (natural language input) |
| Consistency | High (if model repository used) | Variable (depends on prompt quality) |
| Best For | Final documentation, regulated environments | Brainstorming, onboarding, early design |
| Traceability | Excellent (sub-diagram linking) | Good (if generated from model elements) |
| Collaboration | Real-time editing, comments | AI suggestions can spark team discussion |
✅ DO:
• Be specific about container tech stack and responsibilities
• List expected component names/types upfront
• Specify interaction styles (sync/async, protocol)
• Request responsibilities and technology annotations
• Iterate: "Now add caching layer between Service and Repository"

❌ AVOID:
• Vague prompts: "Make a component diagram"
• Overloading: Asking for 20+ components in one go
• Ignoring context: Not mentioning external dependencies
• Expecting perfection: Always review and refine AI output
| Role | Why They Benefit |
|---|---|
| Software Architects | Clarify modular boundaries, validate patterns, communicate vision |
| Tech Leads / Senior Devs | Onboard team members, guide refactoring, review PRs against architecture |
| Developers | Understand where to add features, avoid coupling, navigate codebase |
| Engineering Managers | Assess technical debt, plan team structure, estimate effort |
| Reviewers / Auditors | Verify separation of concerns, security boundaries, compliance |
| Product Owners | Understand technical constraints impacting feature delivery |
| Benefit | Impact |
|---|---|
| Clarity of Responsibilities | Reduces ambiguity about "who does what" in the codebase |
| Improved Onboarding | New hires understand architecture in hours, not weeks |
| Better Refactoring Decisions | Visualize coupling before making structural changes |
| Living Documentation | Diagrams stay relevant when linked to model repository |
| Stakeholder Alignment | Bridge gap between high-level context and implementation |
| Technical Debt Visibility | Spot God components, tight coupling, or missing abstractions |
| Pitfall | Consequence | Solution |
|---|---|---|
| Turning L3 into a class diagram | Overwhelming detail, hard to maintain | Focus on components, not classes |
| Creating diagrams for trivial containers | Wasted effort, diagram fatigue | Only decompose valuable/complex containers |
| Losing external context | Isolated view, misses integration points | Always show entry-point interactions |
| Inconsistent naming across levels | Confusion, broken traceability | Use model repository, reuse elements |
| Overloading with relationships | Visual clutter, unreadable | Show key interactions only; use notes for details |
| Treating diagrams as "one-and-done" | Outdated docs, loss of trust | Schedule updates; integrate with CI/CD if possible |
Here's the complete PlantUML code and the Container Diagam showing the high-level architecture:
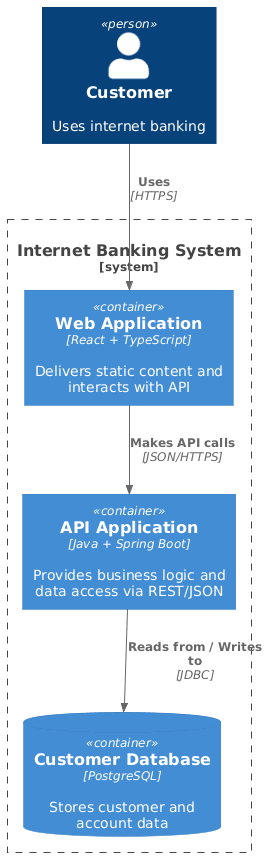
@startuml
!include https://raw.githubusercontent.com/plantuml-stdlib/C4-PlantUML/master/C4_Container.puml

Person(customer, "Customer", "Uses internet banking")

System_Boundary(c4, "Internet Banking System") {
    Container(web, "Web Application", "React + TypeScript", "Delivers static content and interacts with API")
    Container(api, "API Application", "Java + Spring Boot", "Provides business logic and data access via REST/JSON")
    ContainerDb(db, "Customer Database", "PostgreSQL", "Stores customer and account data")
}

Rel(customer, web, "Uses", "HTTPS")
Rel(web, api, "Makes API calls", "JSON/HTTPS")
Rel(api, db, "Reads from / Writes to", "JDBC")
@enduml
What this shows:
This is your Level 2 diagram — the starting point before drilling down.
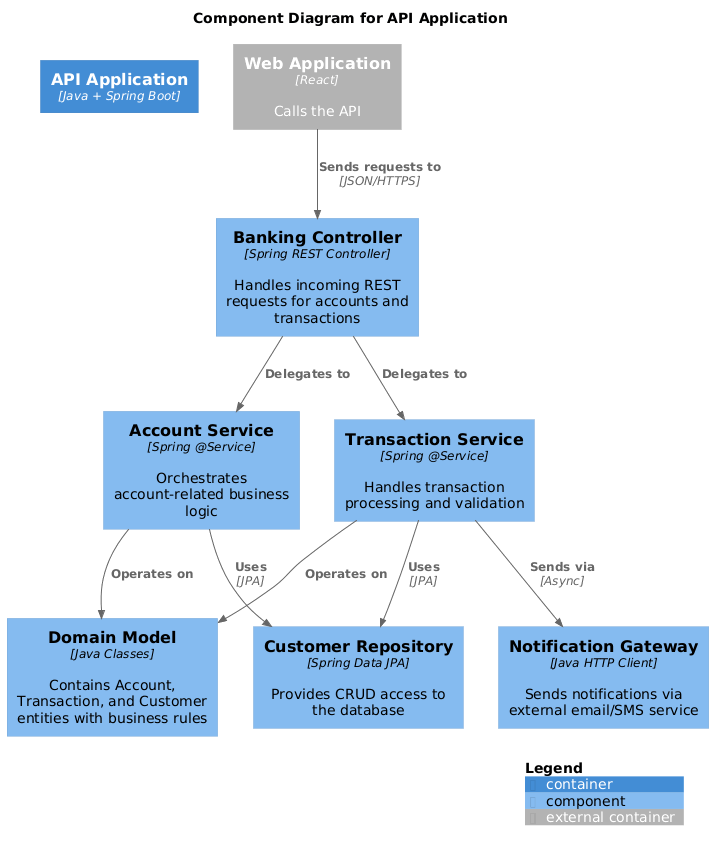
Now, let's drill down into the "API Application" container. Here's the complete PlantUML code and the Diagram:
@startuml
!include https://raw.githubusercontent.com/plantuml-stdlib/C4-PlantUML/master/C4_Component.puml

title Component Diagram for API Application

Container(api, "API Application", "Java + Spring Boot")

' Components inside the container
Component(controller, "Banking Controller", "Spring REST Controller", "Handles incoming REST requests for accounts and transactions")
Component(accountService, "Account Service", "Spring @Service", "Orchestrates account-related business logic")
Component(transactionService, "Transaction Service", "Spring @Service", "Handles transaction processing and validation")
Component(repository, "Customer Repository", "Spring Data JPA", "Provides CRUD access to the database")
Component(gateway, "Notification Gateway", "Java HTTP Client", "Sends notifications via external email/SMS service")
Component(domain, "Domain Model", "Java Classes", "Contains Account, Transaction, and Customer entities with business rules")

' Internal relationships
Rel(controller, accountService, "Delegates to", "")
Rel(controller, transactionService, "Delegates to", "")
Rel(accountService, repository, "Uses", "JPA")
Rel(transactionService, repository, "Uses", "JPA")
Rel(transactionService, gateway, "Sends via", "Async")
Rel(accountService, domain, "Operates on", "")
Rel(transactionService, domain, "Operates on", "")

' External context (from other containers)
Container_Ext(web, "Web Application", "React", "Calls the API")
Rel(web, controller, "Sends requests to", "JSON/HTTPS")

SHOW_LEGEND(true)
@enduml
What this shows:
| Component | Technology | Responsibility |
|---|---|---|
| Banking Controller | Spring REST Controller | Handles incoming REST requests for accounts and transactions |
| Account Service | Spring @Service | Orchestrates account-related business logic |
| Transaction Service | Spring @Service | Handles transaction processing and validation |
| Customer Repository | Spring Data JPA | Provides CRUD access to the database |
| Notification Gateway | Java HTTP Client | Sends notifications via external email/SMS service |
| Domain Model | Java Classes | Contains Account, Transaction, and Customer entities with business rules |
Web App → Banking Controller: Sends requests to (JSON/HTTPS)
Banking Controller → Account Service: Delegates to
Banking Controller → Transaction Service: Delegates to
Account Service → Customer Repository: Uses (JPA)
Transaction Service → Customer Repository: Uses (JPA)
Transaction Service → Notification Gateway: Sends via (Async)
Account Service → Domain Model: Operates on
Transaction Service → Domain Model: Operates on
In Visual Paradigm, this same diagram would be created with:
🔄 Traceability: In Visual Paradigm, double-clicking the "API Application" container in the Level 2 diagram automatically navigates to this Level 3 component diagram.
| Aspect | PlantUML Code | Visual Paradigm GUI |
|---|---|---|
| Creation | Text-based, version-controlled | Drag-and-drop, visual |
| Learning Curve | Requires PlantUML syntax | Intuitive for visual modelers |
| Collaboration | Git-friendly, code reviews | Real-time editing, comments |
| AI Support | Limited | Built-in AI diagram generation |
| Traceability | Manual linking | Automatic sub-diagram navigation |
| Export Options | PNG, SVG, PDF | PNG, SVG, PDF, Word, HTML |
| Best For | DevOps, "diagrams as code" | Enterprise architects, teams |
Hybrid Workflow:
Drilling down from Container (L2) to Component (L3) diagrams in the C4 model is a powerful practice for making software architecture visible, communicable, and maintainable.
Visual Paradigm accelerates this process through:
🎯 Start small: Pick one critical container. Create its component diagram. Validate with your team. Iterate.
When done well, component diagrams become living artifacts that reduce onboarding time, improve architectural decisions, and serve as a single source of truth throughout the software delivery lifecycle.
📌 Next Steps:
Software architecture isn't about creating perfect diagrams—it's about enabling better decisions, faster collaboration, and more resilient systems. The journey from Container (Level 2) to Component (Level 3) diagrams in the C4 model isn't just a modeling exercise; it's a strategic practice that transforms how your team understands, builds, and evolves software.
🔹 Focus creates clarity: Component diagrams shine when you decompose one critical container at a time—not every deployable unit needs this level of detail.
🔹 Traceability matters: Using Visual Paradigm's sub-diagram linking ensures your architecture stays coherent across levels, reducing confusion and rework.
🔹 AI accelerates, humans refine: Leverage Visual Paradigm's AI features to generate first drafts rapidly, then apply human judgment to validate responsibilities, interactions, and architectural intent.
🔹 Living documentation wins: Treat diagrams as collaborative, evolving artifacts—not one-time deliverables. Review them in sprint retros, link them to ADRs, and keep them synchronized with code.
🔹 PlantUML bridges worlds: Export your Visual Paradigm models to PlantUML for version control, code reviews, and "diagrams as code" workflows that developers love.
Don't wait for the "perfect time" to improve your architecture documentation. Start small, start today:
1️⃣ Pick one container in your system that feels complex, unclear, or critical
2️⃣ Open Visual Paradigm and try the AI prompt:
"Create a C4 Component diagram for [Container Name] with 5–7 key components, showing responsibilities, technologies, and interactions"
3️⃣ Refine with your team in a 30-minute walkthrough: "Does this match how the code actually works?"
4️⃣ Export and share: Publish to your team wiki, link to your backlog, or commit the PlantUML to your repo
5️⃣ Repeat: Add one component diagram per sprint. Watch onboarding time drop and architectural confidence rise.
"The best architecture documentation doesn't describe what the system is—it enables people to build what the system should become."
Component diagrams, done well, do exactly that. They turn abstract architecture into shared understanding. They help new engineers contribute faster. They give reviewers confidence. They make refactoring less risky. And with Visual Paradigm—whether you prefer traditional precision or AI-powered speed—you have the tools to make it happen.
Your architecture is a conversation. Make it visual. Make it clear. Make it matter.
🏗️✨ Now go build something great—and document it so others can too.
🔗 Continue Learning:
Architecture is a conversation. Component diagrams help you have that conversation — clearly, consistently, and collaboratively. 🏗️✨