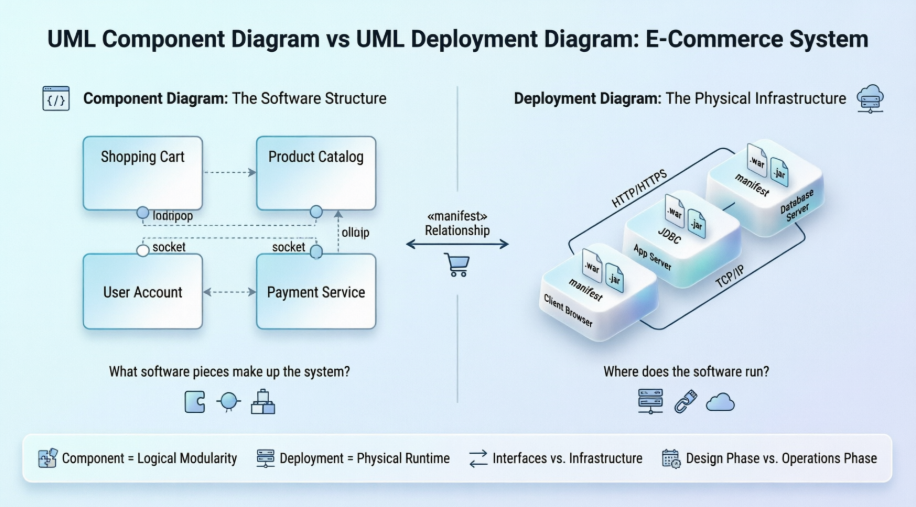
In modern software engineering, successfully delivering complex systems requires more than just writing code—it demands clear architectural communication across development, operations, and stakeholder teams. The Unified Modeling Language (UML) provides a standardized visual vocabulary for this purpose, with structural diagrams playing a pivotal role in system design. Among these, Component and Deployment diagrams are frequently used but often confused. While both are structural diagrams, they address fundamentally different concerns: Component diagrams model the logical organization of software modules and their interfaces, whereas Deployment diagrams map those software artifacts onto physical or virtual infrastructure.
This case study explores both diagram types through a unified, practical scenario: a simple e-commerce application featuring a web storefront and backend database. By walking through the creation and analysis of both a Component Diagram and its corresponding Deployment Diagram, we illustrate how these models complement each other to provide a complete architectural view—from "what we build" to "where it runs." Whether you are a developer designing modular services, a DevOps engineer planning infrastructure, or a technical lead aligning cross-functional teams, understanding the distinct purposes and synergies of these diagrams is essential for building scalable, maintainable systems.
Let's imagine the software architecture for our simple e-commerce system. We need components for:
The storefront (Web UI): Accessible by customers.
The product inventory: Managing products.
The shopping cart: Managing user carts.
The user account database.
Here is the UML Component Diagram, based on the same e-commerce application problem:
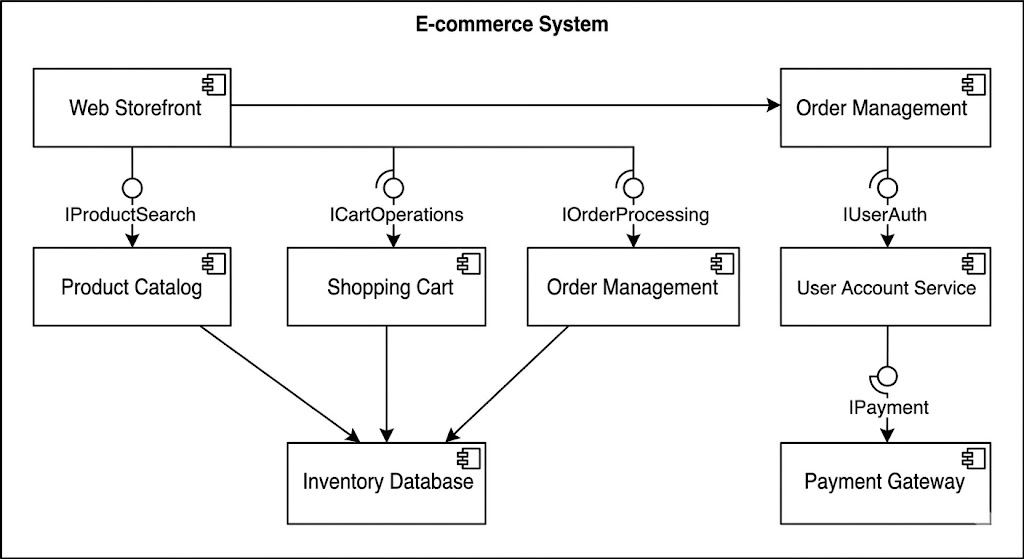
Diagram Analysis:
Components (e.g., Shopping Cart, Product Catalog): These are logical software units with defined interfaces.
Provided Interfaces (Lollipops, ○ ICartOperations): The functionality a component offers to other components.
Required Interfaces (Sockets, ⊂ IProductSearch): The functionality a component needs from others.
Dependencies (Dashed arrows): Show that one component relies on another's interfaces.
This diagram is excellent for developers understanding software modularity and how code libraries interact. It doesn't tell you where this software is hosted.
Now, let's take the exact same e-commerce application and ask: "Where will this software actually run?" To answer this, we need to map the software components onto physical hardware.
Key Concepts in Deployment Diagrams:
Node (3D Cube): A physical execution environment. This can be hardware (a server, a computer, a smartphone) or software (an OS, a container orchestration node, an application server).
Artifact (File Icon): The actual software executable (e.g., .jar, .war, .exe, Docker image, script) that is deployed onto a node.
Communication Path (Solid Line): The network link or physical connection between nodes (e.g., TCP/IP, HTTPS, USB).
Device Node: Specialized hardware (e.g., a card reader, a client PC).
Guidelines for Creating a Deployment Diagram:
Identify the main hardware/infrastructure components (Nodes).
Draw the communication paths between the Nodes.
Specify the main software units (Artifacts) that must exist for the system to function.
Deploy the Artifacts onto their respective Nodes, showing their physical manifestion.
To show how the same system looks from a deployment perspective, we will generate the corresponding Deployment Diagram. Notice how the components defined in the component diagram are now manifested as artifacts running on specific hardware.
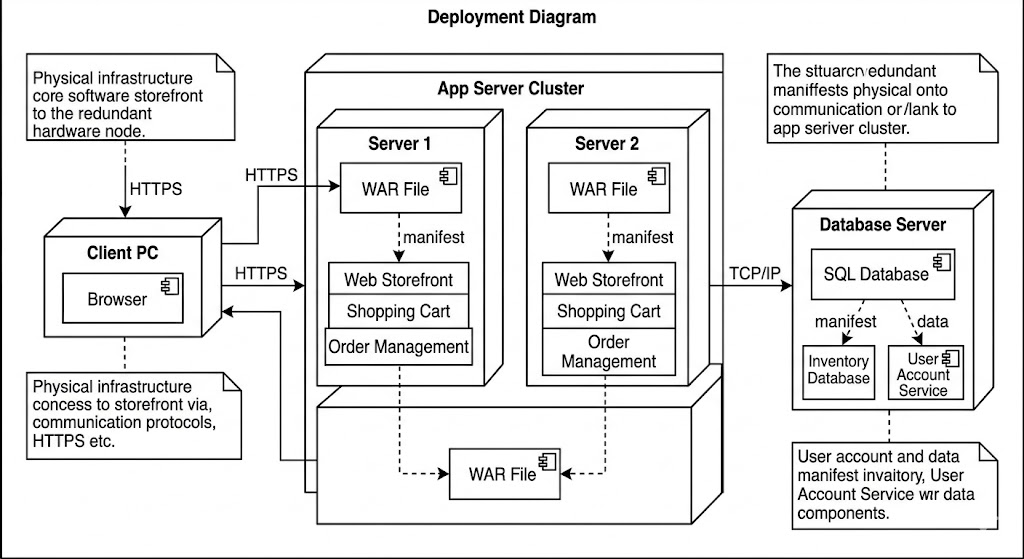
Diagram Analysis ( The Deployment Perspective):
The Deployment Diagram explicitly places the abstract modules from the Component Diagram onto physical infrastructure:
Mapping Artifacts to Components: Notice the dashed dependence relationship with the stereotype «manifest». The diagram shows that the logical component Shopping Cart is manifested as a physical Ecommerce.war artifact. This artifact is deployed on the App Server Node.
Infrastructure Nodes: We now see physical hardware: App Server Node (a dedicated machine), Database Server, and the Client Browser. The abstract "Storefront" component is now split between code running in the client (HTML/JS) and the server-side code (the «manifest» relationship helps bridge this).
Communication Protocols: The abstract interface dependencies from the Component Diagram are replaced by real-world communication paths (HTTP/HTTPS, JDBC, TCP/IP). We know exactly how the components talk over the network.
Summary of Key Concepts and Guidelines
| Feature | UML Component Diagram | UML Deployment Diagram |
|---|---|---|
| Perspective | Logical/Software | Physical/Hardware/Runtime |
| Core Question | What software pieces make up the system? How do they interact? | Where do the software pieces run? How is the network connected? |
| Main Elements | Components, Interfaces (Lollipops), Dependencies. | Nodes (Cubes), Artifacts (Files), Communication Paths. |
| Dependencies | Logical (Interface-based). | Physical (Deployment/Manifest, Network). |
| Usage Scenario | System design, modularity planning, development team coordination. | Operations planning, capacity management, network security design, DevOps. |
| Guidelines | Focus on modularity, high cohesion, and low coupling of components. Identify clear interfaces. | Model physical constraints, redundancy, scalability, and network topology. |
By contrasting component diagram (Software Modules) and the deployment diagram (Hardware Mapping), you gain a complete, layered view of the e-commerce system: first, what we are building (Component), and second, where it will live (Deployment).
Visual Paradigm uses Component diagrams to illustrate the organization and wire-level dependencies of software components.
Key Elements: Supports standard notations like components, interfaces (lollipop and socket), ports, and dependencies.
Modeling Capabilities: Helps visualize the structure of source code, software releases, and how components integrate into the overall design.
Interactive Features: Includes a Resource Catalog for quick creation of relationships and alignment guides for precise positioning.
Deployment diagrams in Visual Paradigm model the physical hardware nodes where software components reside and the communication paths between them.
Infrastructure Modeling: Visualizes run-time configurations, including servers, devices, and virtual nodes, and the artifacts (e.g., .jar, .dll files) deployed on them.
Architecture Planning: Used to map out system topology, network links, and communication protocols (e.g., TCP/IP, HTTP).
Visualization: Uses 3D-style cubes to represent hardware nodes and includes specialized properties for deployed artifacts and locations.
AI Generator: Recent updates allow users to generate UML diagrams—including Component and Deployment diagrams—directly from text descriptions.
Real-time Collaboration: The Cloud edition enables teams to co-create, review, and comment on diagrams concurrently.
Code Engineering: Supports forward and reverse engineering to generate code from models or update diagrams from existing source code.
Component and Deployment diagrams are not competing alternatives—they are complementary lenses through which to view a software system. The Component Diagram answers critical design questions about modularity, interface contracts, and logical dependencies, empowering development teams to build cohesive, testable, and maintainable code. The Deployment Diagram, in turn, addresses operational realities: infrastructure topology, artifact placement, network protocols, and scalability constraints, enabling DevOps and infrastructure teams to plan reliable, secure, and performant deployments.
Using our e-commerce case study, we demonstrated how a single system can be modeled first as a set of interacting software components, then mapped onto a concrete hardware and network environment. This two-step approach ensures that architectural decisions made during design are faithfully realized in production. For organizations adopting agile or DevOps practices, maintaining both views—and the traceability between them via stereotypes like «manifest»—is essential for continuous delivery, infrastructure-as-code workflows, and effective cross-team communication.
Ultimately, mastering both UML Component and Deployment diagrams equips engineering teams to bridge the gap between abstract design and concrete execution. By leveraging modern modeling tools that support AI-assisted generation, real-time collaboration, and code engineering, teams can keep these diagrams living artifacts that evolve alongside the system—driving clarity, reducing risk, and accelerating delivery from concept to cloud.