In modern software development, bridging the gap between object-oriented design and relational database implementation is a critical skill. Developers design systems using UML Class Diagrams to model behavior, structure, and interactions, while database engineers rely on Entity-Relationship Diagrams (ERDs) to define persistent data structures. Understanding how to translate a Class Diagram into an ERD is essential for creating cohesive, maintainable systems where code and data layers work in harmony.
This comprehensive guide walks you through the fundamentals of both modeling techniques, explains their key differences, and provides a practical, step-by-step methodology for converting object-oriented designs into robust database schemas. Whether you're a developer, architect, or student, mastering this transformation process will help you avoid common pitfalls like impedance mismatch, ensure data integrity, and streamline collaboration across development teams.
The UML Class diagram is a graphical notation used to construct and visualize object oriented systems. A class diagram in the Unified Modeling Language (UML) is a type of static structure diagram that describes the structure of a system by showing the system's:
classes,
their attributes,
operations (or methods),
and the relationships among objects.
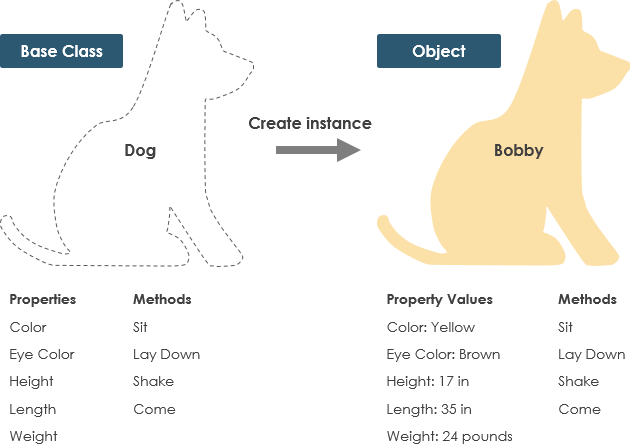
A Class is a blueprint for an object. Objects and classes go hand in hand. We can't talk about one without talking about the other. And the entire point of Object-Oriented Design is not about objects, it's about classes, because we use classes to create objects. So a class describes what an object will be, but it isn't the object itself.
In fact, classes describe the type of objects, while objects are usable instances of classes. Each Object was built from the same set of blueprints and therefore contains the same components (properties and methods). The standard meaning is that an object is an instance of a class and object - Objects have states and behaviors.
A dog has states - color, name, breed as well as behaviors -wagging, barking, eating. An object is an instance of a class.
A class represent a concept which encapsulates state (attributes) and behavior (operations). Each attribute has a type. Each operation has a signature. The class name is the only mandatory information.
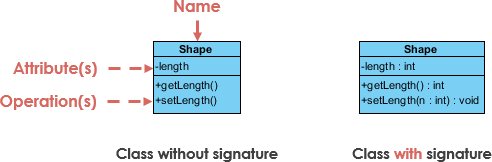
Class Name:
The name of the class appears in the first partition.
Class Attributes:
Attributes are shown in the second partition.
The attribute type is shown after the colon.
Attributes map onto member variables (data members) in code.
Class Operations (Methods):
Operations are shown in the third partition. They are services the class provides.
The return type of a method is shown after the colon at the end of the method signature.
The return type of method parameters are shown after the colon following the parameter name. Operations map onto class methods in code
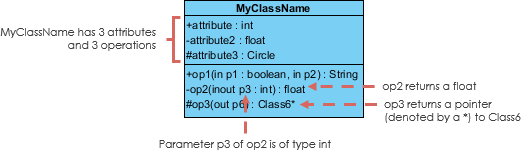
The +, - and # symbols before an attribute and operation name in a class denote the visibility of the attribute and operation.
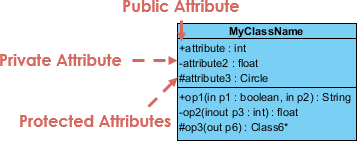
denotes public attributes or operations
- denotes private attributes or operations
# denotes protected attributes or operations
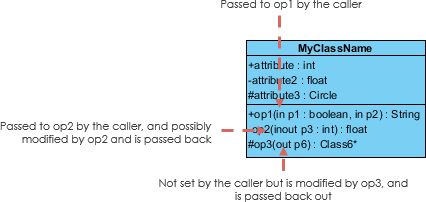
Each parameter in an operation (method) may be denoted as in, out or inout which specifies its direction with respect to the caller. This directionality is shown before the parameter name.
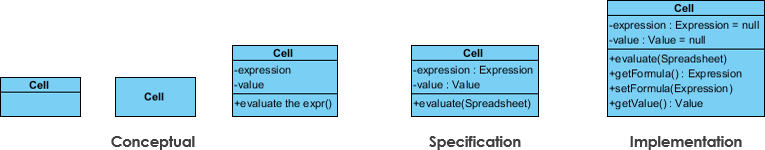
The choice of perspective depends on how far along you are in the development process. During the formulation of a domain model, for example, you would seldom move past the conceptual perspective. Analysis models will typically feature a mix of conceptual and specification perspectives. Design model development will typically start with heavy emphasis on the specification perspective, and evolve into the implementation perspective.
A diagram can be interpreted from various perspectives:
Conceptual: represents the concepts in the domain
Specification: focus is on the interfaces of Abstract Data Type (ADTs) in the software
Implementation: describes how classes will implement their interfaces
The perspective affects the amount of detail to be supplied and the kinds of relationships worth presenting. As we mentioned above, the class name is the only mandatory information.
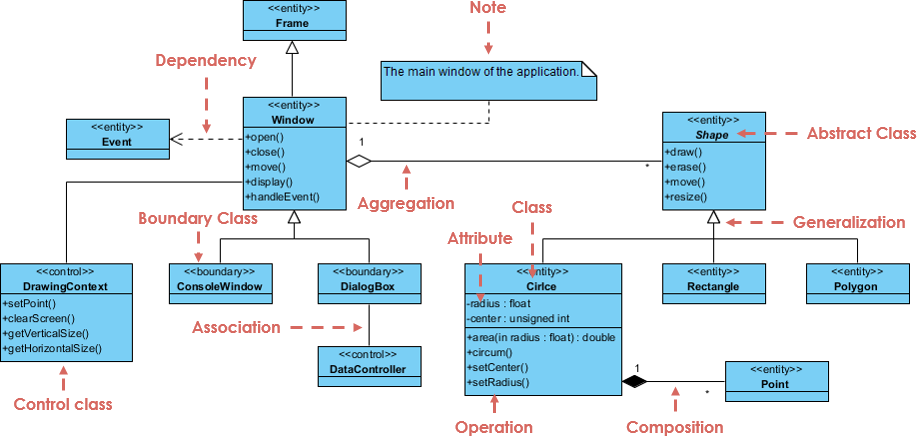
UML is not just about pretty pictures. If used correctly, UML precisely conveys how code should be implemented from diagrams. If precisely interpreted, the implemented code will correctly reflect the intent of the designer. Can you describe what each of the relationships mean relative to your target programming language shown in the Figure below?
If you can't yet recognize them, no problem this section is meant to help you to understand UML class relationships. A class may be involved in one or more relationships with other classes. A relationship can be one of the following types:
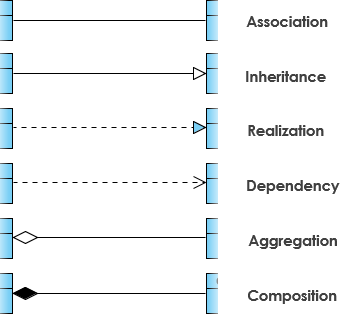
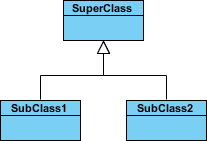
A generalization is a taxonomic relationship between a more general classifier and a more specific classifier. Each instance of the specific classifier is also an indirect instance of the general classifier. Thus, the specific classifier inherits the features of the more general classifier.
Represents an "is-a" relationship.
An abstract class name is shown in italics.
SubClass1 and SubClass2 are specializations of SuperClass.
The figure below shows an example of inheritance hierarchy. SubClass1 and SubClass2 are derived from SuperClass. The relationship is displayed as a solid line with a hollow arrowhead that points from the child element to the parent element.
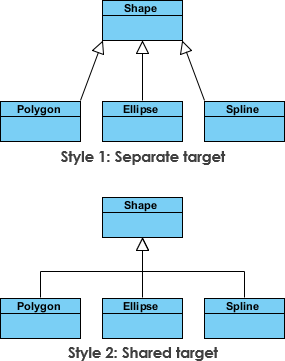
The figure below shows an inheritance example with two styles. Although the connectors are drawn differently, they are semantically equivalent.
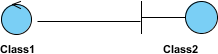
Associations are relationships between classes in a UML Class Diagram. They are represented by a solid line between classes. Associations are typically named using a verb or verb phrase which reflects the real world problem domain.
A structural link between two peer classes.
There is an association between Class1 and Class2
The figure below shows an example of simple association. There is an association that connects the <> class Class1 and <> class Class2. The relationship is displayed as a solid line connecting the two classes.
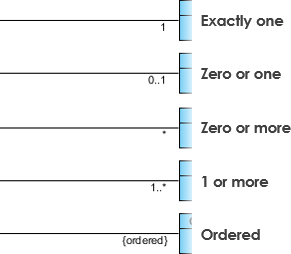
Cardinality is expressed in terms of:
one to one
one to many
many to many
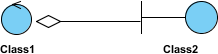
A special type of association.
It represents a "part of" relationship.
Class2 is part of Class1.
Many instances (denoted by the *) of Class2 can be associated with Class1.
Objects of Class1 and Class2 have separate lifetimes.
The figure below shows an example of aggregation. The relationship is displayed as a solid line with a unfilled diamond at the association end, which is connected to the class that represents the aggregate.
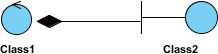
A special type of aggregation where parts are destroyed when the whole is destroyed.
Objects of Class2 live and die with Class1.
Class2 cannot stand by itself.
The figure below shows an example of composition. The relationship is displayed as a solid line with a filled diamond at the association end, which is connected to the class that represents the whole or composite.
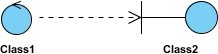
An object of one class might use an object of another class in the code of a method. If the object is not stored in any field, then this is modeled as a dependency relationship.
A special type of association.
Exists between two classes if changes to the definition of one may cause changes to the other (but not the other way around).
Class1 depends on Class2
The figure below shows an example of dependency. The relationship is displayed as a dashed line with an open arrow.
The figure below shows another example of dependency. The Person class might have a hasRead method with a Book parameter that returns true if the person has read the book (perhaps by checking some database).

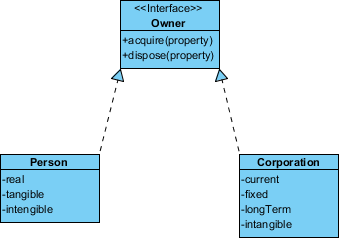
Realization is a relationship between the blueprint class and the object containing its respective implementation level details. This object is said to realize the blueprint class. In other words, you can understand this as the relationship between the interface and the implementing class.
For example, the Owner interface might specify methods for acquiring property and disposing of property. The Person and Corporation classes need to implement these methods, possibly in very different ways.
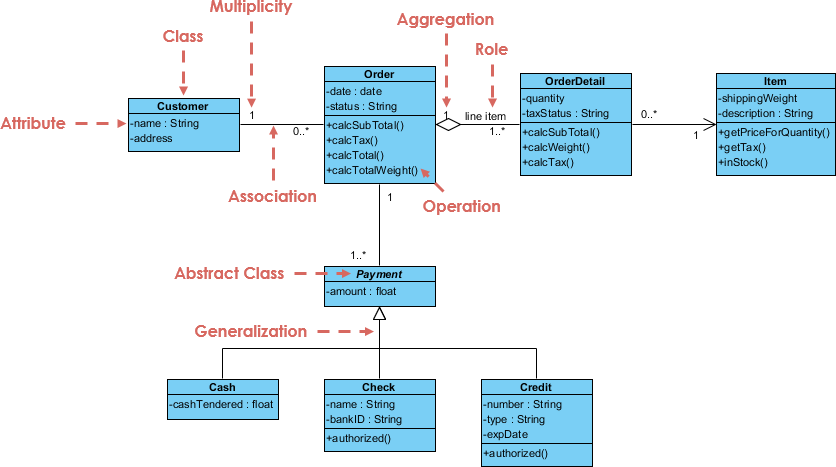
A class diagram may also have notes attached to classes or relationships.

Database is absolutely an integral part of software systems. To fully utilize ER Diagram in database engineering guarantees you to produce high-quality database design to use in database creation, management, and maintenance. An ER model also provides a means for communication.
Today we're going to walk you through everything you need to know about ER Diagramming. By reading this ERD guide, you will get the essential knowledge and skills about ER Diagrams and database design. You will learn things like what is ERD, why ERD, ERD notations, how to draw ERD, etc. along with a bunch of ERD examples.
First of all, what is an Entity Relationship Diagram?
Entity Relationship Diagram, also known as ERD, ER Diagram or ER model, is a type of structural diagram for use in database design. An ERD contains different symbols and connectors that visualize two important information: The major entities within the system scope, and the inter-relationships among these entities.
And that's why it's called "Entity" "Relationship" diagram (ERD)!
When we talk about entities in ERD, very often we are referring to business objects such as people/roles (e.g. Student), tangible business objects (e.g. Product), intangible business objects (e.g. Log), etc. "Relationship" is about how these entities relate to each other within the system.
In a typical ER design, you can find symbols such as rounded rectangles and connectors (with different styles of their ends) that depict the entities, their attributes, and inter-relationships.
So, when do we draw ERDs? While ER models are mostly developed for designing relational databases in terms of concept visualization and in terms of physical database design, there are still other situations when ER diagrams can help. Here are some typical use cases.
Database design - Depending on the scale of change, it can be risky to alter a database structure directly in a DBMS. To avoid ruining the data in a production database, it is important to plan out the changes carefully. ERD is a tool that helps. By drawing ER diagrams to visualize database design ideas, you have a chance to identify the mistakes and design flaws, and to make corrections before executing the changes in the database.
Database debugging - To debug database issues can be challenging, especially when the database contains many tables, which require writing complex SQL in getting the information you need. By visualizing a database schema with an ERD, you have a full picture of the entire database schema. You can easily locate entities, view their attributes and identify the relationships they have with others. All these allow you to analyze an existing database and to reveal database problems easier.
Database creation and patching - Visual Paradigm, an ERD tool, supports a database generation tool that can automate the database creation and patching process by means of ER diagrams. So, with this ER Diagram tool, your ER design is no longer just a static diagram but a mirror that reflects truly the physical database structure.
Aid in requirements gathering - Determine the requirements of an information system by drawing a conceptual ERD that depicts the high-level business objects of the system. Such an initial model can also be evolved into a physical database model that aids the creation of a relational database, or aids in the creation of process maps and data flow modes.
An ER Diagram contains entities, attributes, and relationships. In this section, we will go through the ERD symbols in detail.
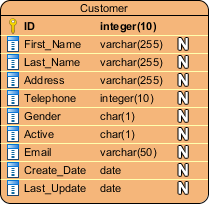
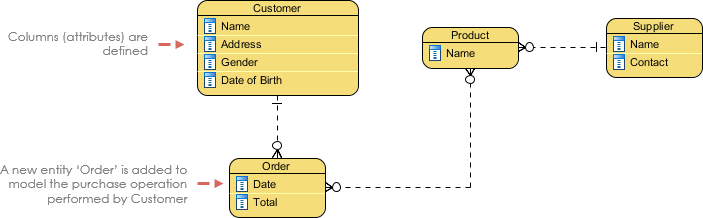
An ERD entity is a definable thing or concept within a system, such as a person/role (e.g. Student), object (e.g. Invoice), concept (e.g. Profile) or event (e.g. Transaction) (note: In ERD, the term "entity" is often used instead of "table", but they are the same). When determining entities, think of them as nouns. In ER models, an entity is shown as a rounded rectangle, with its name on top and its attributes listed in the body of the entity shape. The ERD example below shows an example of an ER entity.

Also known as a column, an attribute is a property or characteristic of the entity that holds it.
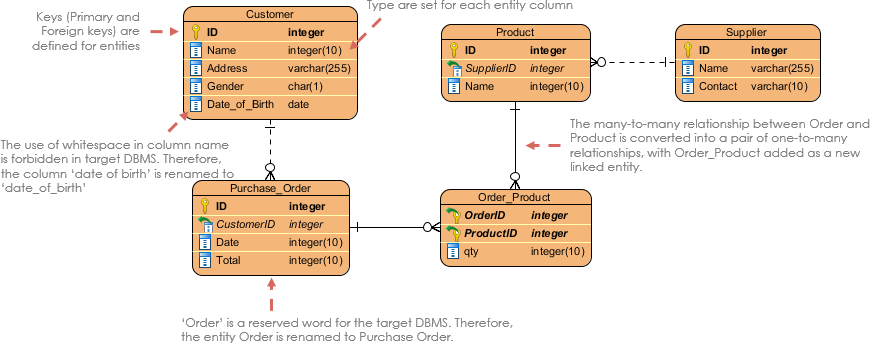
An attribute has a name that describes the property and a type that describes the kind of attribute it is, such as varchar for a string, and int for integer. When an ERD is drawn for physical database development, it is important to ensure the use of types that are supported by the target RDBMS.
The ER diagram example below shows an entity with some attributes in it.
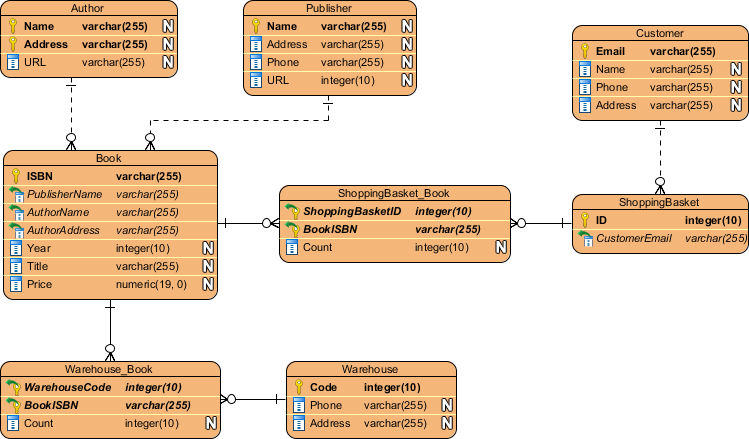
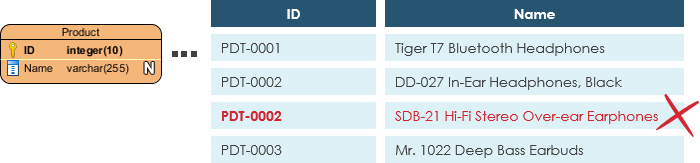
Also known as PK, a primary key is a special kind of entity attribute that uniquely defines a record in a database table. In other words, there must not be two (or more) records that share the same value for the primary key attribute. The ERD example below shows an entity 'Product' with a primary key attribute 'ID', and a preview of table records in the database. The third record is invalid because the value of ID 'PDT-0002' is already used by another record.
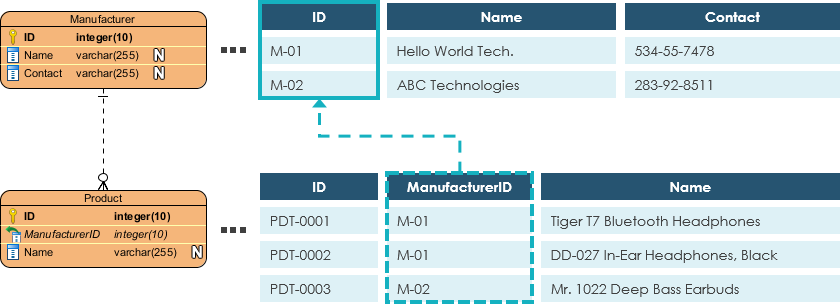
Also known as FK, a foreign key is a reference to a primary key in a table. It is used to identify the relationships between entities. Note that foreign keys need not be unique. Multiple records can share the same values. The ER Diagram example below shows an entity with some columns, among which a foreign key is used in referencing another entity.
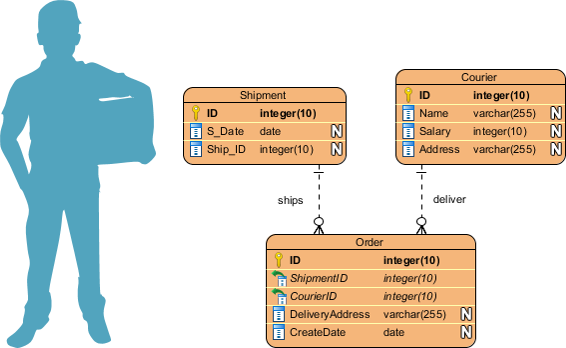
A relationship between two entities signifies that the two entities are associated with each other somehow. For example, a student might enroll in a course. The entity Student is therefore related to Course, and a relationship is presented as a connector connecting between them.
Cardinality defines the possible number of occurrences in one entity which is associated with the number of occurrences in another. For example, ONE team has MANY players. When present in an ERD, the entity Team and Player are inter-connected with a one-to-many relationship.
In an ER diagram, cardinality is represented as a crow's foot at the connector's ends. The three common cardinal relationships are one-to-one, one-to-many, and many-to-many.
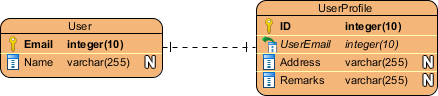
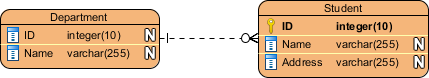
A one-to-one relationship is mostly used to split an entity in two to provide information concisely and make it more understandable. The figure below shows an example of a one-to-one relationship.
A one-to-many relationship refers to the relationship between two entities X and Y in which an instance of X may be linked to many instances of Y, but an instance of Y is linked to only one instance of X. The figure below shows an example of a one-to-many relationship.
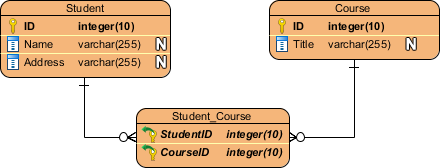
A many-to-many relationship refers to the relationship between two entities X and Y in which X may be linked to many instances of Y and vice versa. The figure below shows an example of a many-to-many relationship. Note that a many-to-many relationship is split into a pair of one-to-many relationships in a physical ERD. You will know what a physical ERD is in the next section.
An ER model is typically drawn at up to three levels of abstraction:
Conceptual ERD / Conceptual data model
Logical ERD / Logical data model
Physical ERD / Physical data model
While all the three levels of an ER model contain entities with attributes and relationships, they differ in the purposes they are created for and the audiences they are meant to target.
A general understanding to the three data models is that business analyst uses a conceptual and logical model to model the business objects exist in the system, while database designer or database engineer elaborates the conceptual and logical ER model to produce the physical model that presents the physical database structure ready for database creation. The table below shows the difference between the three data models.
Conceptual model vs Logical model vs Data model:
| ERD features | Conceptual | Logical | Physical |
|---|---|---|---|
| Entity (Name) | Yes | Yes | Yes |
| Relationship | Yes | Yes | Yes |
| Columns | Yes | Yes | |
| Column's Types | Optional | Yes | |
| Primary Key | Yes | ||
| Foreign Key | Yes |
Conceptual ERD models the business objects that should exist in a system and the relationships between them. A conceptual model is developed to present an overall picture of the system by recognizing the business objects involved. It defines what entities exist, NOT which tables. For example, 'many to many' tables may exist in a logical or physical data model but they are just shown as a relationship with no cardinality under the conceptual data model.
NOTE: Conceptual ERD supports the use of generalization in modeling the 'a kind of' relationship between two entities, for instance, Triangle, is a kind of Shape. The usage is like generalization in UML. Notice that only conceptual ERD supports generalization.
Logical ERD is a detailed version of a Conceptual ERD. A logical ER model is developed to enrich a conceptual model by defining explicitly the columns in each entity and introducing operational and transactional entities. Although a logical data model is still independent of the actual database system in which the database will be created, you can still take that into consideration if it affects the design.
Physical ERD represents the actual design blueprint of a relational database. A physical data model elaborates on the logical data model by assigning each column with type, length, nullable, etc. Since a physical ERD represents how data should be structured and related in a specific DBMS it is important to consider the convention and restriction of the actual database system in which the database will be created. Make sure the column types are supported by the DBMS and reserved words are not used in naming entities and columns.
If you find it difficult to get started with drawing an ER diagram, don't worry. In this section, we will give you some ERD tips. Try to follow the steps below to understand how to draw an ER diagram effectively.
Make sure you are clear about the purpose of drawing the ERD. Are you trying to present an overall system architecture that involves the definition of business objects? Or are you developing an ER model ready for database creation? You must be clear about the purpose to develop an ER diagram at the right level of detail
Make sure you are clear about the scope to model. Knowing the modeling scope prevents you from including redundant entities and relationships in your design.
Draw the major entities involved in the scope.
Define the properties of entities by adding columns.
Review the ERD carefully and check if the entities and columns are enough to store the data of the system. If not, consider adding additional entities and columns. Usually, you can identify some transactional, operational and event entities in this step.
Consider the relationships between all entities and relate them with proper cardinality (e.g A one-to-many between entity Customer and Order). Don't worry if there are orphan entities. Although it's not common, it's legit.
Apply the technique of database normalization to re-structure the entities in a way that can reduce data redundancy and improve data integrity. For example, the details of the manufacturer might be stored under the Product entity initially. During the process of normalization, you may find that the detail keeps repeating records over records, then you can split it as a separate entity Manufacturer, and with a foreign key that links between Product and Manufacturer.
In system analysis and design, Data Flow Diagram (DFD) can be drawn to visualize the flow of information within system processes. In a Data Flow Diagram, there is a symbol called Data Store, which represents a database table that provides the information needed by the system.
Since a physical ER Diagram provides a blueprint of an actual database, the entities in such an ERD are aligned with datastores in a DFD. You can draw ERD as a complement to DFD by representing the structure of information that flows within a system, or, on the contrary, to draw DFD in complementing an ERD by showing how the data will be utilized by the system in runtime.
In business process mapping, BPMN Business Process Diagram (BPD) can be drawn to visualize business workflows. In a Business Process Diagram, there is a symbol called Data Object, which represents the data input into / output from process activities.
Since a conceptual and logical data model provides a high-level view of business objects within a system, the entities in such ERDs are aligned with data objects in BPD. You can draw ERD as a complement to BPD by representing the structure of data objects needed by a business workflow, or, on the contrary, to draw BPD in complementing an ERD by showing how the data will be utilized throughout a business process.
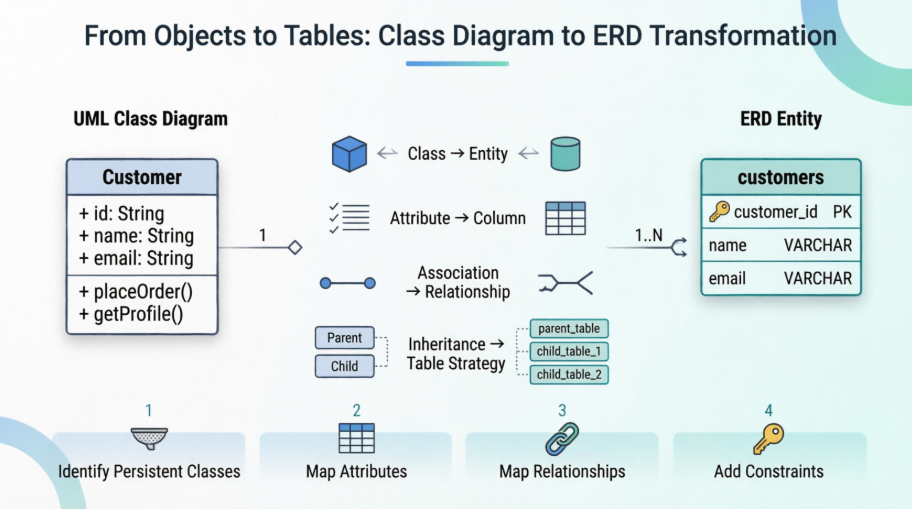
In software engineering, the Class Diagram (part of UML) and the Entity-Relationship Diagram (ERD) serve related but distinct purposes. Converting a class diagram into an ERD is a common step when moving from object-oriented design to relational database implementation. This section explains the differences, the reasons for the conversion, key concepts, practical guidelines, and a step-by-step process.
| Aspect | Class Diagram (UML) | ERD (Entity-Relationship) |
|---|---|---|
| Primary Focus | Behavior + Structure of software objects | Data structure and persistence |
| Main Elements | Classes, Attributes, Methods/Operations | Entities, Attributes, Relationships |
| Relationships | Association, Aggregation, Composition, Inheritance, Dependency | One-to-One, One-to-Many, Many-to-Many |
| Multiplicity | Detailed (0..1, 1, , 0.., etc.) | Cardinality (1:1, 1:N, M:N) |
| Methods | Includes operations/behavior | No methods (data only) |
| Data Types | Programming language types (String, int) | Database types (VARCHAR, INTEGER, DATE) |
| Inheritance | Supported natively | Handled via supertype/subtype or separate tables |
| Purpose | Object-oriented system design | Logical/physical database schema |
Class diagrams are conceptual and behavioral; ERDs are data-centric and implementation-oriented.
Bridge the Gap — Class diagrams model runtime objects; databases store persistent data in tables. Conversion translates OO concepts into relational structures.
Data Integrity — Ensures relationships are properly normalized and constraints (keys, referential integrity) are defined.
Performance & Scalability — Relational databases require explicit foreign keys, indexes, and normalization that class diagrams don't address directly.
Team Collaboration — Developers think in classes; DBAs and data engineers think in entities and tables.
Avoid Impedance Mismatch — Prevents common pitfalls when persisting objects (e.g., handling inheritance, collections, or complex associations).
Class → Entity: A class with persistent data becomes an entity (table).
Attribute → Column: Simple attributes become columns. Complex attributes (objects, collections) often require new entities or junction tables.
Association → Relationship: Links between classes become foreign key relationships.
Inheritance → Table Strategy:
Single Table Inheritance
Joined Table (Table per Class)
Table per Concrete Class
Aggregation/Composition → Often becomes a foreign key with cascade rules.
Many-to-Many → Requires an associative (junction) entity/table.
Step 1: Identify Persistent Classes
Exclude purely behavioral or transient classes. Focus on domain entities (e.g., Customer, Order, Product).
Step 2: Map Attributes
Convert primitive attributes to columns with appropriate data types.
Identify candidate primary keys (often an id attribute or natural key).
Handle complex attributes:
Value objects (e.g., Address) → Embed as columns or separate entity.
Collections → New entity + relationship.
Step 3: Map Relationships
One-to-One: Foreign key in one or both tables.
One-to-Many: Foreign key in the "many" side.
Many-to-Many: Create a junction table with foreign keys to both sides.
Add multiplicity/cardinality constraints.
Step 4: Handle Inheritance
Decide on a strategy based on needs:
Single Table: All subclasses in one table with a discriminator column.
Joined: Parent table + child tables with foreign keys.
Concrete: Separate tables for each concrete class (duplicated columns).
Step 5: Add Constraints & Metadata
Primary Keys (PK)
Foreign Keys (FK) with referential actions (ON DELETE CASCADE, etc.)
Unique constraints, indexes, defaults, nullability
Check constraints or triggers if needed
Step 6: Normalize
Apply 3NF or BCNF as appropriate while preserving business rules. Resolve any denormalization decisions for performance.
Step 7: Validate & Refine
Review with domain experts and DBAs. Generate the physical DDL if moving to implementation.
Start Logical, Then Physical: Create a logical ERD first (business concepts), then a physical one (with actual column types and indexes).
Naming Conventions:
Entities/Tables: Singular or plural consistently (e.g., Customer or Customers).
Columns: snake_case or camelCase per your DB standard.
Foreign Keys: parent_id or parentId.
Avoid Over-Engineering: Not every class needs a table. Some relationships can be denormalized.
Document Decisions: Especially inheritance strategy and any denormalizations.
Tools: Use Lucidchart, Draw.io, ER/Studio, dbdiagram.io, or Visual Paradigm for both diagrams and automatic conversion features.
Common Pitfalls:
Treating every association as Many-to-Many.
Ignoring weak entities (dependent entities that need a parent key).
Forgetting surrogate vs. natural keys.
Modern Considerations: For NoSQL or hybrid systems, the mapping may lead to document structures or graph relationships instead of strict tables.
Class Diagram Snippet:
Order (orderId, orderDate, totalAmount) — has many OrderItem
OrderItem (quantity, price) — belongs to Product
Resulting ERD:
orders table (order_id PK, order_date, total_amount)
order_items table (order_item_id PK, order_id FK, product_id FK, quantity, price)
products table (product_id PK, ...)
The many-to-many between Order and Product is resolved via the order_items associative entity.
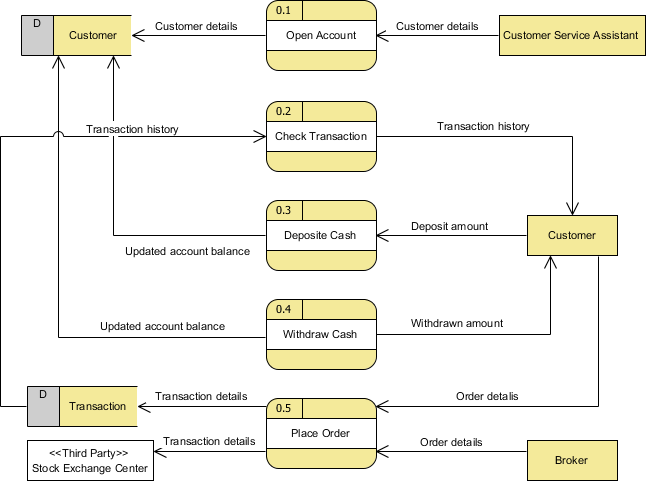
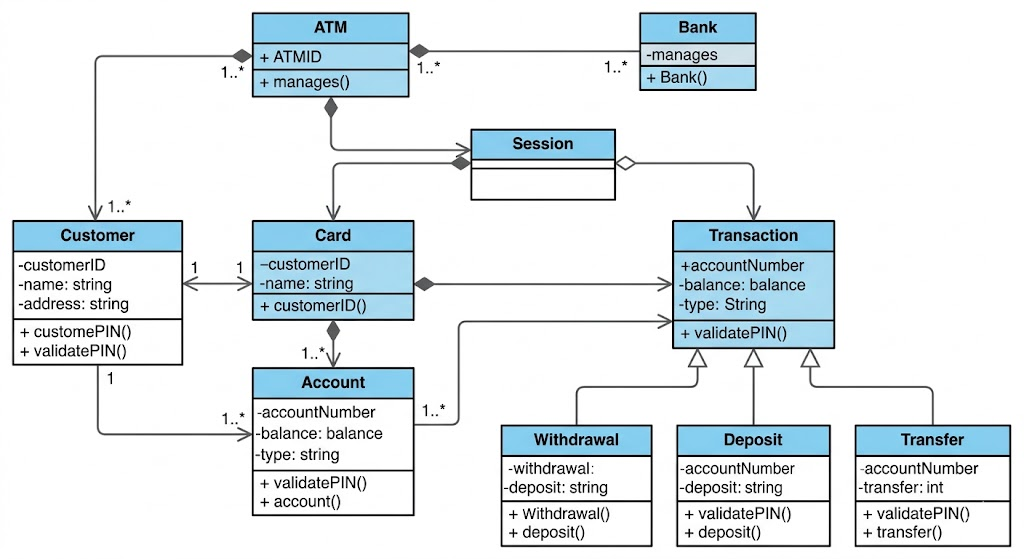
This ATM case study illustrates the transition from an object-oriented conceptual model (Class Diagram) to a data persistence model (ERD) for a realistic ATM system. The main refinement involves identifying transient session data (which stays in the Class Diagram) and persistent entity data (which is mapped to the ERD).
This class diagram represents the logical structure of the ATM software. It focuses on relationships and responsibilities. Key refinements for the eventual database mapping are highlighted in blue:
Transient State: Note that the ATM class and the Session class track runtime data (like cashOnHand or currentTransaction). These are operations and logical states, not data that needs to be permanently stored in this structure in a database.
Inheritance: The diagram uses inheritance for Transaction, Card, and Account. These logical relationships (e.g., a Withdrawal is a Transaction) must be converted into relational tables.
Operations: All classes include methods (e.g., validatePIN(), updateBalance()). These define behavior but are omitted in the ERD, which only models data storage.
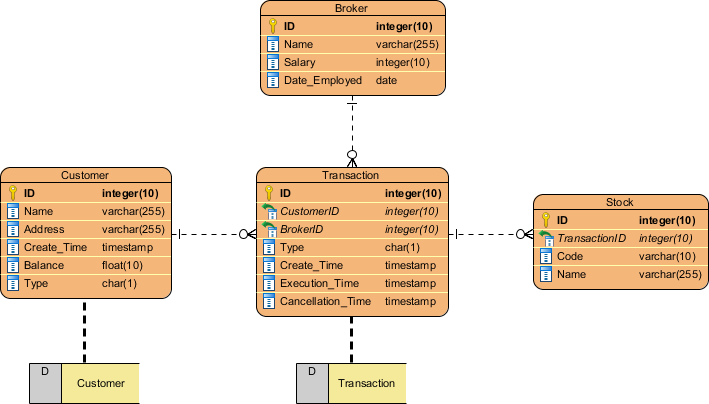
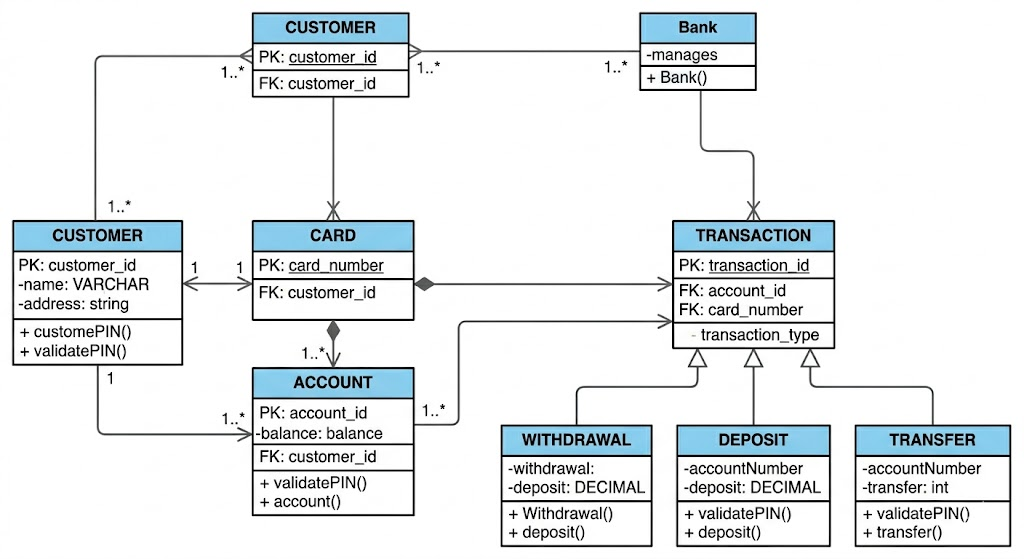
This diagram visualizes how the conceptual classes from Image 1 are refined into a relational database schema. The focus shifts from object responsibilities to data persistence, primary keys (PK), and foreign keys (FK).
Refinement Details (Class Diagram to ERD):
Removal of Transient Data: Notice that the ATM class and the runtime Session class are completely absent. The database does not need to store the ATM's current cash physical inventory or logical session state; it only records the results of actions (the Transactions).
Inheritance Flattening (Table-per-Type): The inheritance tree for Transaction has been refined. Instead of four separate tables, the generalized data is stored in the main TRANSACTION table. A transaction_type discriminator (e.g., 'W' for Withdrawal) identifies the specific type. (A similar flattening was applied to CARD and ACCOUNT, merging logical subtypes into single tables).
Key Migration: Relationships from Image 1 (like "Card belongs to Customer") are refined into data constraints. The CUSTOMER_ID (PK) of the CUSTOMER table now appears as a Foreign Key (FK) in the CARD table, enforcing the relationship.
Omission of Methods: The methods defined in the Class Diagram (e.g., validatePIN()) are stripped away. The ERD only defines the structure of the data, not how software operates upon it.
Visual Paradigm provides an integrated platform that supports both Class Diagrams for object-oriented design and Entity Relationship Diagrams (ERDs) for database modeling. The software is specifically designed to bridge the gap between these two models through automated synchronization and Object-Relational Mapping (ORM) capabilities.
Bidirectional Synchronization: You can automatically transform a Class Diagram into an ERD and vice versa. This ensures that changes in your object model are reflected in your data model, maintaining consistency throughout the development lifecycle.
Object-Relational Mapping (ORM): Visual Paradigm supports ORM, allowing you to map data models to object models. This facilitates the generation of executable persistence layers (like Hibernate) directly from your diagrams.
Comprehensive ERD Tools: The platform supports conceptual, logical, and physical data models. It includes features for database schema generation (DDL), SQL statement generation, and reverse engineering existing databases into ERDs.
AI-Powered Generation: Modern versions include AI tools that can generate both Class Diagrams and ERDs from text descriptions or problem statements, speeding up the initial design phase.
Inheritance Strategy Support: When synchronizing between models, the tool can handle different inheritance strategies (e.g., Table-per-Class, Table-per-Subclass), automatically creating or re-creating entities to respect the chosen strategy.
To keep your designs in sync, you can use the following built-in tools:
Class to ERD: Go to Tools > Hibernate > Synchronize to Entity Relationship Diagram. This maps classes to entities and associations to relationships.
ERD to Class: Go to Tools > Hibernate > Synchronize to Class Diagram. This transforms your database entities back into an object-oriented class structure.
Converting a class diagram to an ERD is not a mechanical 1:1 translation—it requires thoughtful design decisions that balance object-oriented principles with relational database realities. By understanding the distinct purposes of each modeling technique, mastering the mapping concepts, and following a structured transformation process, you can create systems where the code and data layers work harmoniously.
This integration reduces bugs, improves maintainability, and supports long-term scalability. Whether you're a developer building the next feature, an architect designing system foundations, or a student learning software engineering fundamentals, practicing this mapping on real domain models is one of the best ways to deepen your understanding of both object-oriented design and data modeling.
Start with a small domain—such as an e-commerce platform, library system, or task manager—and iterate. Use modern tools to automate repetitive tasks, but always validate the output against business requirements. With practice, transforming Class Diagrams into ERDs will become an intuitive part of your development workflow, enabling you to deliver robust, well-architected software solutions.
Synchronizing Class Diagram and ERD: Learn how to keep your object model and data model in sync using Visual Paradigm's bidirectional synchronization features.
Comprehensive Guide: From Problem Statement to Class Diagram, ERD and Database Modeling with Visual Paradigm: A detailed walkthrough covering the entire modeling lifecycle from requirements to database implementation.
Unified Modeling Language (UML) Introduction: Foundational overview of UML concepts, notation, and applications in software design.
ER Diagram and Class Diagram Synchronization - Object-Relational Mapping: Explore Visual Paradigm's ORM capabilities for seamless translation between object and relational models.
Free ERD Tool for Database Design: Access professional-grade Entity Relationship Diagramming tools at no cost for personal and educational use.
Data Modeling Gallery: ERD Examples and Tutorials: Browse real-world ERD examples, templates, and step-by-step tutorials for various industries.
Different Inheritance Strategies in Database Modeling: Understand how to map class inheritance hierarchies to relational tables using Single Table, Joined Table, or Concrete Table strategies.
Tutorial: Generate Class Diagram from ERD: Step-by-step instructions for reverse-engineering object-oriented class structures from existing database schemas.
Generate Class Diagram from ERD - Visual Paradigm Tutorial: Interactive guide demonstrating the ERD-to-Class Diagram transformation workflow with screenshots and best practices.
Synchronization Guide: Class Diagram and ERD: Comprehensive documentation on maintaining consistency between object and data models throughout the development lifecycle.