In today's complex digital ecosystems, organizations rarely operate with just one or two software systems. Most enterprises juggle dozens, if not hundreds, of interconnected applications, services, and platforms. While traditional architecture documentation often focuses intensely on individual systems, this narrow view can obscure the bigger picture—how everything fits together, where dependencies lie, and what the overall technology portfolio looks like.
Enter the C4 System Landscape Diagram. As an essential addition to Simon Brown's widely-adopted C4 model, the Landscape diagram provides the missing "helicopter view" that enterprise architects, technology leaders, and stakeholders desperately need. It answers fundamental questions about your organization's software ecosystem before you zoom into the details of any single system.
This comprehensive guide will walk you through everything you need to know about C4 System Landscape Diagrams: what they are, why they matter, when to use them, and how to create them using modern tools like Visual Paradigm and PlantUML. Whether you're documenting a sprawling enterprise architecture or simply trying to make sense of your organization's technology stack, this guide will equip you with the knowledge and practical examples to create effective Landscape diagrams that bring clarity to complexity.
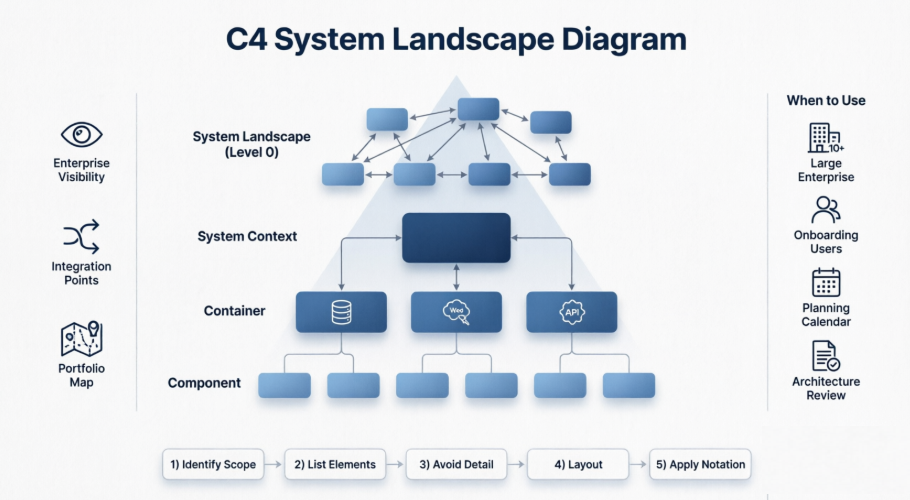
The C4 model (Context, Containers, Components, Code), created by Simon Brown, provides a hierarchical, abstraction-first way to visualize software architecture. The core four levels focus on a single software system. However, in real-world enterprises, systems do not exist in isolation.
The System Landscape Diagram (often called the C4 Landscape Diagram or Level 0) is a supplementary diagram that sits above the System Context diagram. It provides a high-level map of multiple software systems within a chosen scope (e.g., department, division, or entire organization/enterprise).
It shows how various software systems fit together, including interactions between them, users/groups, and external entities. It acts as an "enterprise overview" or "big picture map" without focusing on any single system.
To answer questions like:
Unlike a System Context diagram (which zooms in on one system in the center), the Landscape diagram treats all systems more equally, giving a broader, portfolio-level view.
The core C4 levels (Context → Container → Component → Code) are excellent for documenting individual systems but can feel narrow in large organizations with dozens or hundreds of systems.
In short: It prevents "missing the forest for the trees" when your organization has many interconnected systems.
Use it when:
It is optional but highly valuable in complex environments. For small teams or single-system projects, it may not add much value.
Decide the boundary (e.g., "All systems in the Customer Engagement division").
Do not show containers or components; keep it at the Software System abstraction level.
Place systems logically (e.g., by business domain, technology, or user journey). Use boundaries or zones if helpful.
Follow C4 style: Boxes for Software Systems (usually with technology tags if relevant), stick figures or boxes for people, labeled arrows for relationships.
Keep it simple, readable, and focused on structure and relationships rather than behavior.
Visual Paradigm offers excellent native support for the full C4 model, especially in its Desktop edition (as of late 2025 updates). It supports all six key C4 diagram types:
This makes Visual Paradigm one of the strongest modeling tools for end-to-end C4 modeling, moving beyond generic drawing to true first-class C4 support.
The model emphasizes selective ignorance (abstraction) to avoid cluttered diagrams.
C4-PlantUML is a popular open-source library for creating C4 diagrams as code (text → diagram).
Here are ready-to-use examples. You can copy-paste them into any PlantUML renderer (e.g., plantuml.com or IDE plugins).
@startuml
!include https://raw.githubusercontent.com/plantuml-stdlib/C4-PlantUML/master/C4_Container.puml
LAYOUT_WITH_LEGEND()
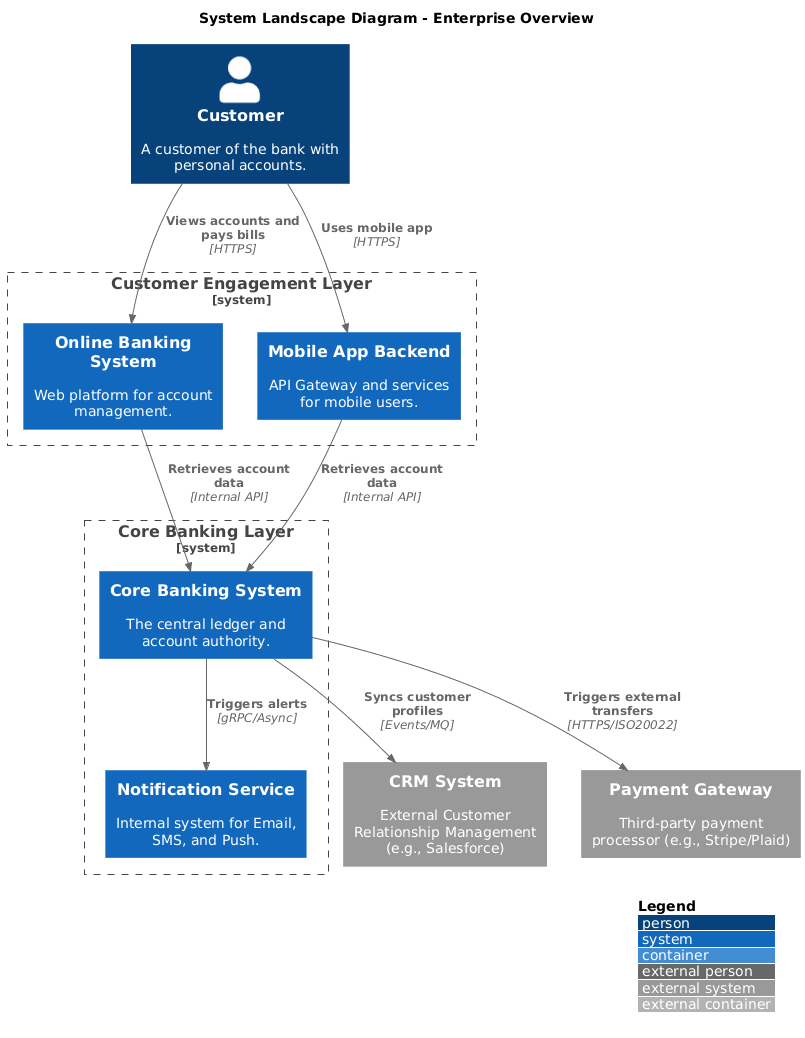
title System Landscape Diagram - Enterprise Overview
' Actors
Person(Customer, "Customer", "A customer of the bank with personal accounts.")
' External Systems
System_Ext(CRM, "CRM System", "External Customer Relationship Management (e.g., Salesforce)")
System_Ext(PaymentGateway, "Payment Gateway", "Third-party payment processor (e.g., Stripe/Plaid)")
' Internal Systems
System_Boundary("customer_portal", "Customer Engagement Layer") {
System(OnlineBanking, "Online Banking System", "Web platform for account management.")
System(MobileAppBackend, "Mobile App Backend", "API Gateway and services for mobile users.")
}
System_Boundary("core_services", "Core Banking Layer") {
System(CoreBanking, "Core Banking System", "The central ledger and account authority.")
System(NotificationService, "Notification Service", "Internal system for Email, SMS, and Push.")
}
' Relationships
Rel(Customer, OnlineBanking, "Views accounts and pays bills", "HTTPS")
Rel(Customer, MobileAppBackend, "Uses mobile app", "HTTPS")
Rel(MobileAppBackend, CoreBanking, "Retrieves account data", "Internal API")
Rel(OnlineBanking, CoreBanking, "Retrieves account data", "Internal API")
Rel(CoreBanking, CRM, "Syncs customer profiles", "Events/MQ")
Rel(CoreBanking, PaymentGateway, "Triggers external transfers", "HTTPS/ISO20022")
Rel(CoreBanking, NotificationService, "Triggers alerts", "gRPC/Async")
@enduml
@startuml
!include https://raw.githubusercontent.com/plantuml-stdlib/C4-PlantUML/master/C4_Context.puml
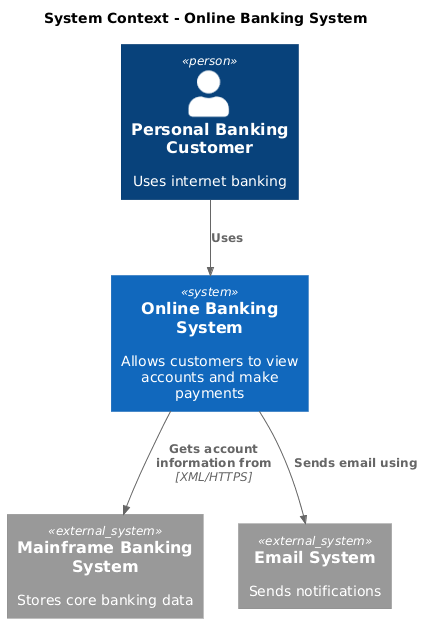
title System Context - Online Banking System
Person(customer, "Personal Banking Customer", "Uses internet banking")
System(onlineBanking, "Online Banking System", "Allows customers to view accounts and make payments")
System_Ext(mainframe, "Mainframe Banking System", "Stores core banking data")
System_Ext(email, "Email System", "Sends notifications")
Rel(customer, onlineBanking, "Uses")
Rel(onlineBanking, mainframe, "Gets account information from", "XML/HTTPS")
Rel(onlineBanking, email, "Sends email using")
@enduml
You can extend these with C4_Component.puml or C4_Deployment.puml includes for deeper levels. The Landscape version simply shows more systems at equal priority without one central "in scope" system.
For more advanced examples, check the official C4-PlantUML samples on GitHub.
The C4 System Landscape Diagram is an invaluable tool for anyone working with complex, multi-system architectures. By providing that crucial "30,000-foot view" of your organization's software ecosystem, it helps bridge the communication gap between technical teams, enterprise architects, and business stakeholders.
While the core C4 model excels at documenting individual systems in detail, the Landscape diagram ensures you never lose sight of how those systems interconnect and support broader business objectives. It's particularly powerful when used as a starting point for architecture documentation, a reference map for onboarding, or a strategic planning tool for modernization initiatives.
Whether you choose to create your Landscape diagrams using sophisticated tools like Visual Paradigm with AI-powered generation, or prefer the simplicity and version-control benefits of C4-PlantUML, the key is to start mapping your enterprise architecture today. Remember: the goal isn't perfection—it's clarity, communication, and creating a shared understanding of your technology landscape.
By combining the broad perspective of the System Landscape Diagram with the detailed views of Context, Container, and Component diagrams, you'll build a comprehensive, maintainable architecture documentation set that scales with your organization and serves multiple audiences effectively.