In the complex world of software development, clarity is power. Before a single line of code is written, successful teams rely on visual modeling to align stakeholders, define requirements, and architect robust systems. Among the most powerful tools in this endeavor are two foundational diagrams from the Unified Modeling Language (UML): the Use Case Diagram and the Class Diagram.
While Use Case Diagrams help us capture what a system should do from the user's perspective, Class Diagrams define how the system is structured to deliver that functionality. Together, they form a complementary pair that bridges the gap between business needs and technical implementation.
This comprehensive guide walks you through both diagram types—from core concepts and notation to practical integration strategies—empowering you to model software systems with confidence, precision, and purpose. Whether you're a business analyst, developer, architect, or student, you'll find actionable insights to elevate your UML practice.
A UML use case diagram is the primary form of system/software requirements for a new software program under development. Use cases specify the expected behavior (what), and not the exact method of making it happen (how). Use cases once specified can be denoted both textual and visual representation (i.e. use case diagram). A key concept of use case modeling is that it helps us design a system from the end user's perspective. It is an effective technique for communicating system behavior in the user's terms by specifying all externally visible system behavior.
A use case diagram is usually simple. It does not show the detail of the use cases:
It only summarizes some of the relationships between use cases, actors, and systems.
It does not show the order in which steps are performed to achieve the goals of each use case.
As said, a use case diagram should be simple and contains only a few shapes. If yours contain more than 20 use cases, you are probably misusing use case diagram.
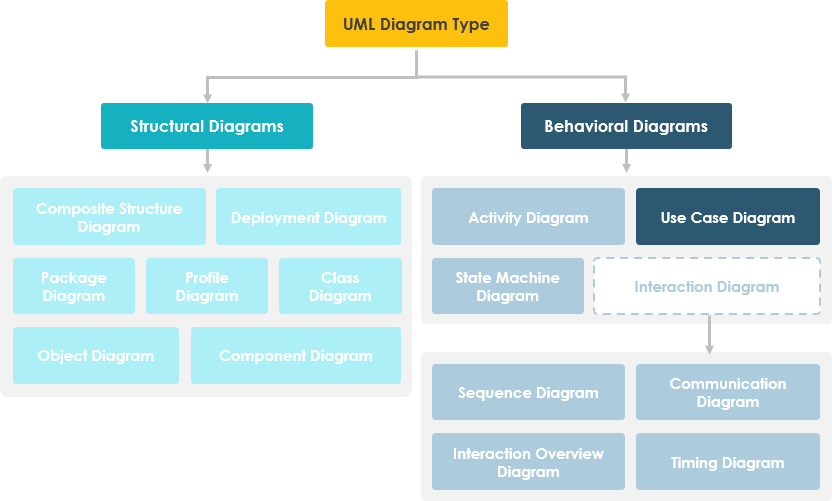
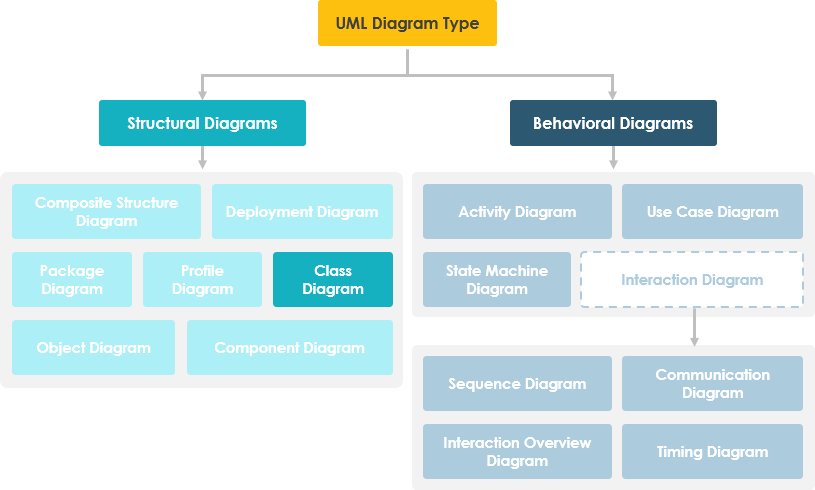
The figure below shows the UML diagram hierarchy and the positioning of the UML Use Case Diagram. As you can see, use case diagrams belong to the family of behavioral diagrams.
Note that:
There are many different UML diagrams that serve different purposes (as you can see from the UML diagram tree above). You can describe those details in other UML diagram types and documents, and have them be linked from use cases.
Use cases represent only the functional requirements of a system. Other requirements such as business rules, quality of service requirements, and implementation constraints must be represented separately, again, with other UML diagrams.
These days use case modeling is often associated with UML, although it has been introduced before UML existed. Its brief history is as follow:
In 1986, Ivar Jacobson first formulated textual and visual modeling techniques for specifying use cases.
In 1992 his co-authored book Object-Oriented Software Engineering - A Use Case Driven Approach helped to popularize the technique for capturing functional requirements, especially in software development.
Use case diagrams are typically developed in the early stage of development and people often apply use case modeling for the following purposes:
Specify the context of a system
Capture the requirements of a system
Validate a systems architecture
Drive implementation and generate test cases
Developed by analysts together with domain experts
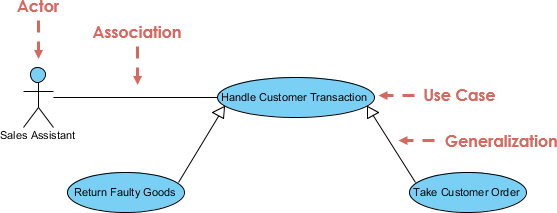
A standard form of use case diagram is defined in the Unified Modeling Language as shown in the Use Case Diagram example below:
| Notation Description | Visual Representation |
|---|---|
Actor
|
 |
Use Case
|
 |
Communication Link
|
 |
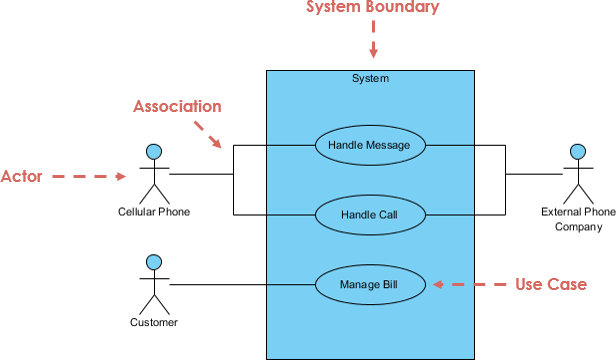
Boundary of system
|
 |
Use cases share different kinds of relationships. Defining the relationship between two use cases is the decision of the software analysts of the use case diagram. A relationship between two use cases is basically modeling the dependency between the two use cases. The reuse of an existing use case by using different types of relationships reduces the overall effort required in developing a system. Use case relationships are listed as the following:
| Use Case Relationship | Visual Representation |
|---|---|
Extends
|
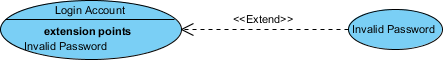 |
Include
|
 |
Generalization
|
 |
In software engineering, a class diagram in the Unified Modeling Language (UML) is a type of static structure diagram that describes the structure of a system by showing the system's classes, their attributes, operations (or methods), and the relationships among objects.
Shows static structure of classifiers in a system
Diagram provides a basic notation for other structure diagrams prescribed by UML
Helpful for developers and other team members too
Business Analysts can use class diagrams to model systems from a business perspective
A UML class diagram is made up of:
A set of classes and
A set of relationships between classes
A description of a group of objects all with similar roles in the system, which consists of:
Structural features (attributes) define what objects of the class "know"
Represent the state of an object of the class
Are descriptions of the structural or static features of a class
Behavioral features (operations) define what objects of the class "can do"
Define the way in which objects may interact
Operations are descriptions of behavioral or dynamic features of a class
A class notation consists of three parts:
Class Name
The name of the class appears in the first partition.
Class Attributes
Attributes are shown in the second partition.
The attribute type is shown after the colon.
Attributes map onto member variables (data members) in code.
Class Operations (Methods)
Operations are shown in the third partition. They are services the class provides.
The return type of a method is shown after the colon at the end of the method signature.
The return type of method parameters is shown after the colon following the parameter name.
Operations map onto class methods in code

The graphical representation of the class - MyClass as shown above:
MyClass has 3 attributes and 3 operations
Parameter p3 of op2 is of type int
op2 returns a float
op3 returns a pointer (denoted by a *) to Class6
A class may be involved in one or more relationships with other classes. A relationship can be one of the following types: (Refer to the figure on the right for the graphical representation of relationships).
| Relationship Type | Graphical Representation |
|---|---|
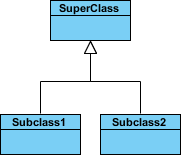
Inheritance (or Generalization):
|
 |
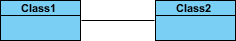
Simple Association:
|
 |
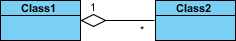
| Aggregation: A special type of association. It represents a "part of" relationship. |
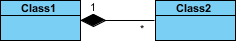
Composition:
A special type of aggregation where parts are destroyed when the whole is destroyed.
Dependency:
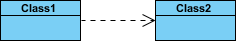
Names of relationships are written in the middle of the association line.
Good relation names make sense when you read them out loud:
"Every spreadsheet contains some number of cells",
"an expression evaluates to a value"
They often have a small arrowhead to show the direction in which direction to read the relationship, e.g., expressions evaluate to values, but values do not evaluate to expressions.
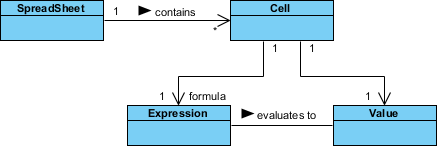
A role is a directional purpose of an association.
Roles are written at the ends of an association line and describe the purpose played by that class in the relationship.
E.g., A cell is related to an expression. The nature of the relationship is that the expression is the formula of the cell.
The arrows indicate whether, given one instance participating in a relationship, it is possible to determine the instances of the other class that are related to it.
The diagram above suggests that,
Given a spreadsheet, we can locate all of the cells that it contains, but that
we cannot determine from a cell in what spreadsheet it is contained.
Given a cell, we can obtain the related expression and value, but
given a value (or expression) we cannot find the cell of which those are attributes.
In object-oriented design, there is a notation of visibility for attributes and operations. UML identifies four types of visibility: public, protected, private, and package.
The +, -, # and ~ symbols before an attribute and operation name in a class denote the visibility of the attribute and operation.
denotes public attributes or operations
- denotes private attributes or operations
# denotes protected attributes or operations
~ denotes package attributes or operations
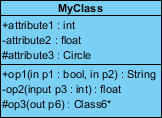
In the example above:
attribute1 and op1 of MyClassName are public
attribute3 and op3 are protected.
attribute2 and op2 are private.
Access for each of these visibility types is shown below for members of different classes.
| Access Right | public (+) | private (-) | protected (#) | Package (~) |
|---|---|---|---|---|
| Members of the same class | yes | yes | yes | yes |
| Members of derived classes | yes | no | yes | yes |
| Members of any other class | yes | no | no | in same package |
How many objects of each class take part in the relationships and multiplicity can be expressed as:
Exactly one - 1
Zero or one - 0..1
Many - 0..* or *
One or more - 1..*
Exact Number - e.g. 3..4 or 6
Or a complex relationship - e.g. 0..1, 3..4, 6.* would mean any number of objects other than 2 or 5
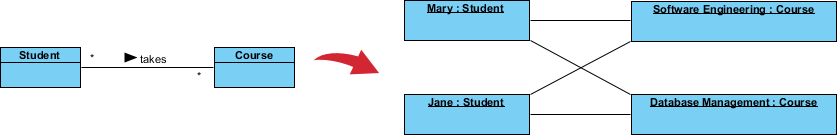
Requirement: A Student can take many Courses and many Students can be enrolled in one Course.
In the example below, the class diagram (on the left), describes the statement of the requirement above for the static model while the object diagram (on the right) shows the snapshot (an instance of the class diagram) of the course enrollment for the courses Software Engineering and Database Management respectively)
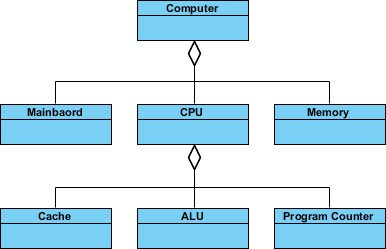
An aggregation is a special case of association denoting a "consists-of" hierarchy
The aggregate is the parent class, the components are the children classes
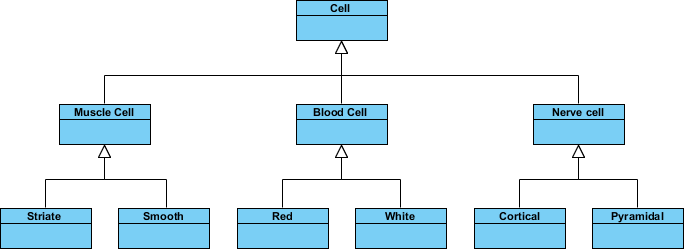
Inheritance is another special case of an association denoting a "kind-of" hierarchy
Inheritance simplifies the analysis model by introducing a taxonomy
The child classes inherit the attributes and operations of the parent class.
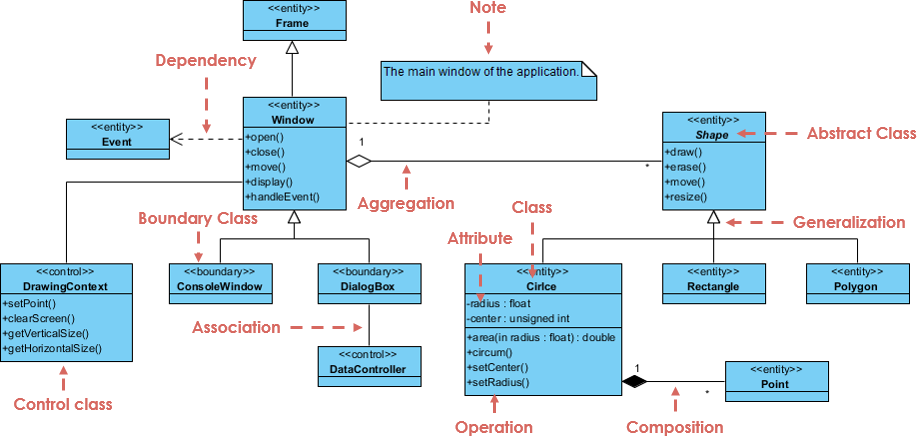
A class diagram may also have notes attached to classes or relationships. Notes are shown in grey.

In the example above:
We can interpret the meaning of the above class diagram by reading through the points as following.
Shape is an abstract class. It is shown in Italics.
Shape is a superclass. Circle, Rectangle and Polygon are derived from Shape. In other words, a Circle is-a Shape. This is a generalization / inheritance relationship.
There is an association between DialogBox and DataController.
Shape is part-of Window. This is an aggregation relationship. Shape can exist without Window.
Point is part-of Circle. This is a composition relationship. Point cannot exist without a Circle.
Window is dependent on Event. However, Event is not dependent on Window.
The attributes of Circle are radius and center. This is an entity class.
The method names of Circle are area(), circum(), setCenter() and setRadius().
The parameter radius in Circle is an in parameter of type float.
The method area() of class Circle returns a value of type double.
The attributes and method names of Rectangle are hidden. Some other classes in the diagram also have their attributes and method names hidden.
Inevitably, if you are modeling a large system or a large business area, there will be numerous entities you must consider. Should we use multiple or a single class diagram for modeling the problem? The answer is:
Instead of modeling every entity and its relationships on a single class diagram, it is better to use multiple class diagrams.
Dividing a system into multiple class diagrams makes the system easier to understand, especially if each diagram is a graphical representation of a specific part of the system.
We can use class diagrams in different development phases of a software development lifecycle and typically by modeling class diagrams in three different perspectives (levels of detail) progressively as we move forward:
Conceptual perspective: The diagrams are interpreted as describing things in the real world. Thus, if you take the conceptual perspective you draw a diagram that represents the concepts in the domain under study. These concepts will naturally relate to the classes that implement them. The conceptual perspective is considered language-independent.
Specification perspective: The diagrams are interpreted as describing software abstractions or components with specifications and interfaces but with no commitment to a particular implementation. Thus, if you take the specification perspective we are looking at the interfaces of the software, not the implementation.
Implementation perspective: The diagrams are interpreted as describing software implementations in a particular technology and language. Thus, if you take the implementation perspective we are looking at the software implementation.
| Aspect | Use Case Diagram | Class Diagram |
|---|---|---|
| UML Type | Behavioral (dynamic) | Structural (static) |
| Focus | What the system does from a user/actor perspective | How the system is structured to support those behaviors |
| Core Elements | Actors, Use Cases, System Boundary, Relationships (include, extend, generalization) |
Classes, Attributes, Operations, Relationships (association, aggregation, composition, inheritance, dependency) |
| Connection | Each use case is realized by one or more collaborating classes. Use case descriptions (scenarios) drive the identification of classes, attributes, and methods. |
💡 Key Insight: Use cases define functional requirements; class diagrams define the structural blueprint that fulfills those requirements. They are complementary, not interchangeable.
| Diagram | Best Used When | Primary Audience |
|---|---|---|
| Use Case Diagram | • Early requirements gathering • Defining system scope & boundaries • Communicating with stakeholders, product owners, or clients • Prioritizing features for sprints/releases |
Business analysts, stakeholders, product managers, QA |
| Class Diagram | • System analysis & design phase • Modeling domain concepts & data structures • Planning database schema or API contracts • Preparing for implementation/coding |
Developers, architects, database designers, senior engineers |
Use Case Diagram → Class Diagram is the standard and most logical order.
Why?
Requirements before structure: You must know what the system should do before deciding how to organize it.
Risk reduction: Jumping straight to classes often leads to over-engineering, missing requirements, or tightly coupled designs.
Traceability: Starting with use cases creates a clear audit trail from stakeholder needs → functional scenarios → structural design → code.
📌 Note: In Agile/iterative projects, you may cycle between them frequently, but the conceptual dependency remains: use cases drive class design.
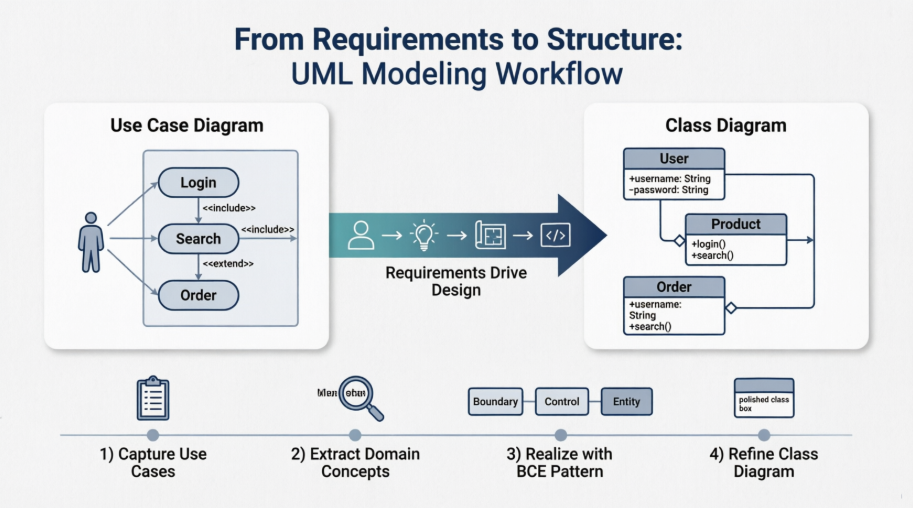
Follow this practical workflow to bridge the two diagrams:
| Step | Activity | Output |
|---|---|---|
| 1. Capture Use Cases | Identify actors, write use case descriptions (brief/main/alternate flows) | Use Case Diagram + Use Case Specifications |
| 2. Extract Domain Concepts | Pull nouns from use case texts → candidate classes/attributes. Pull verbs → candidate operations. | Initial Domain/Analysis Class Diagram |
| 3. Realize Use Cases | For each use case, identify collaborating classes using patterns like Boundary-Control-Entity (BCE): • Boundary = UI/API/External Interface• Control = Business logic/Workflow• Entity = Domain data/persistence |
Use Case Realization sketches or Sequence Diagrams |
| 4. Refine Class Diagram | Add visibility, multiplicities, design patterns, architectural layers, and implementation details | Detailed Design Class Diagram |
| 5. Maintain Traceability | Link each use case to the classes/methods that realize it (via UML «realize» relationships, traceability matrix, or tool tags) |
Traceable, maintainable model |
🛠️ Pro Tip: Use Sequence Diagrams or Communication Diagrams as the "glue" between use cases and class diagrams. They show exactly which classes interact to fulfill a given use case.
| Pitfall | Consequence | How to Fix |
|---|---|---|
| Skipping use cases and going straight to classes | Missing requirements, scope creep, poor stakeholder alignment | Always start with user goals & system boundaries |
| Making class diagrams too early or too detailed | Over-engineering, brittle design | Keep early class diagrams at the analysis level (no methods/visibility) |
| Treating diagrams as isolated artifacts | Lost traceability, hard to validate design against requirements | Use modeling tools that support traceability links or maintain a simple mapping table |
Start with Use Case Diagram to capture what the system does
Use case narratives → extract nouns/verbs → draft Domain Class Diagram
Apply BCE pattern or sequence diagrams to realize each use case
Refine into a Design Class Diagram with operations, visibility, and relationships
Maintain traceability from use cases → classes → code
Iterate, but respect the conceptual order: Behavior → Structure
This flow aligns with UML best practices, RUP, and modern iterative development. If you're using a specific methodology (Agile, Waterfall, DDD, etc.), you can tailor the workflow accordingly.
Visual Paradigm provides robust support for both Use Case and Class diagrams through a professional modeling suite available as a desktop application and an online UML tool. It offers advanced features like AI-assisted generation, integrated documentation, and code engineering.
Rich Modeling Elements: Supports standard UML notations including actors, use cases, and relationships such as association, <<include>>, <<extend>>, and generalization.
Detailed Documentation: Beyond simple drawing, you can record a "Flow of Events" using a dedicated editor that supports conditional logic (if-then-else) and looping.
AI Generation: Features an AI-powered tool where you can input a domain description to automatically generate and refine use case diagrams.
Requirement Identification: Used to specify system context and functional requirements from an end-user perspective.
Static Structure Modeling: Provides tools to define classes, attributes, operations (methods), and complex relationships like inheritance, multiplicity, and roles.
Code Engineering: Supports code generation and reverse engineering, allowing developers to transition directly from design to implementation or update models from existing code.
Database Integration: Can map class diagrams to Entity Relationship Diagrams (ERD) for synchronizing object models with data models.
Flexible Presentation: Includes options to toggle the visibility of attributes/operations and switch between different notation styles or layout preferences.
| Feature | Use Case Diagram | Class Diagram |
|---|---|---|
| Primary Goal | Model functional requirements & user goals | Model static system structure & data |
| Key Components | Actors, Use Cases, System Boundary | Classes, Attributes, Operations |
| Advanced Tools | Flow of Events Editor, Test Plan integration | Code Generation (ORM), Database Mapping |
| AI Support | Domain-to-diagram generation | Class and relationship identification from scope |
Mastering Use Case and Class Diagrams is not just about learning UML notation—it's about developing a disciplined approach to software design that bridges human needs with technical execution. Use Case Diagrams keep us grounded in user value, ensuring we build the right system. Class Diagrams provide the architectural rigor to build that system right.
When used together in a logical, iterative workflow, these diagrams become powerful communication tools that align cross-functional teams, reduce ambiguity, and create a living blueprint for development. Whether you're documenting legacy systems, designing greenfield applications, or facilitating stakeholder workshops, investing time in these foundational models pays dividends in clarity, quality, and confidence.
Remember: great software isn't built by jumping straight to code. It's built by thinking deeply about behavior, structure, and the relationships between them. Start with the user. Model the intent. Design the structure. Then build with purpose.
Use Case Diagram Software: Explore professional tools for creating, editing, and sharing UML Use Case Diagrams with collaborative features and AI assistance.
Step-by-Step Class Diagram Tutorial: A hands-on walkthrough for building Class Diagrams with practical examples and tool tips.
What is a Use Case Diagram? : Comprehensive introduction to Use Case Diagrams, including notation, purpose, and best practices.
UML Class Diagram Tutorial: Detailed guide covering Class Diagram fundamentals, relationships, visibility, and advanced modeling techniques.
Use Case Diagram Documentation: Official documentation for creating and managing Use Case Diagrams in Visual Paradigm.
Documenting Use Cases with Flow of Events: Learn how to specify detailed use case scenarios using conditional logic and structured editors.
Use Case Modeling Solutions: Industry solutions and case studies demonstrating effective use case modeling practices.
Use Case Diagram Video Tutorial: Visual walkthrough of creating Use Case Diagrams with tool demonstrations.
Class Diagram Video Tutorial: Step-by-step video guide for building Class Diagrams from scratch.
AI-Powered Use Case Modeling: Discover how AI tools can accelerate use case discovery and diagram refinement.
Class Diagram Presentation Options: Customize the visual style and layout of your Class Diagrams for clarity and impact.
Synchronizing Object and Data Models: Techniques for aligning Class Diagrams with database schemas and ERDs.
AI Class Diagram Generator: Leverage AI to rapidly generate and refine Class Diagrams from natural language descriptions.
Use Case Modeling Studio: AI-powered tool for extracting domain classes and relationships from behavioral specifications.
Visual Paradigm AI Ecosystem Guide: Overview of AI capabilities across Visual Paradigm's modeling platform.