In today's complex software development and business process environments, clear communication is everything. Teams often struggle to align on how systems work, how processes flow, or how components interact—leading to costly misunderstandings and rework. Enter UML: the Unified Modeling Language.
UML isn't just another diagramming standard. It's a universal visual language that helps developers, architects, business analysts, and stakeholders speak the same language. Whether you're designing a microservices architecture, documenting an employee onboarding workflow, or planning a new feature, UML diagrams provide the clarity that text alone cannot.
This comprehensive guide walks you through all 14 UML diagram types—split into structural and behavioral categories—with practical examples, use cases, and modern tooling tips. You'll discover which diagrams matter most for your work, how AI is transforming UML creation, and why getting your diagrams right is more critical than ever in the age of intelligent automation.
Let's dive in.
Unified Modeling Language (UML) is a visual modeling framework used to specify, document, and communicate the architecture and behavior of complex systems. Think of it as the "blueprint language" for software—and increasingly, for business processes, system integrations, and organizational workflows [[9]].
Before UML, the software industry faced a Tower of Babel problem. In the early 1990s, developers and architects relied on dozens of incompatible diagramming notations. One team's object model was indecipherable to another. Collaboration suffered. Knowledge transfer stalled.
Enter Grady Booch, James Rumbaugh, and Ivar Jacobson—the "Three Amigos" of software engineering. While working at Rational Software, they merged their respective methodologies (Booch, OMT, and OOSE) into a single, cohesive notation. The result? UML was born.
1996: First public specification submitted to the Object Management Group (OMG)
1997: Adopted as an industry standard by OMG
2017: UML 2.5.1 released—the current specification, a testament to its enduring design [[1]]
UML's longevity isn't accidental. Its strength lies in three core principles:
🔹 Abstraction over implementation
UML focuses on what a system does and how components interact—not the syntax of a particular programming language. This makes diagrams portable across technologies and teams.
🔹 A toolkit, not a straitjacket
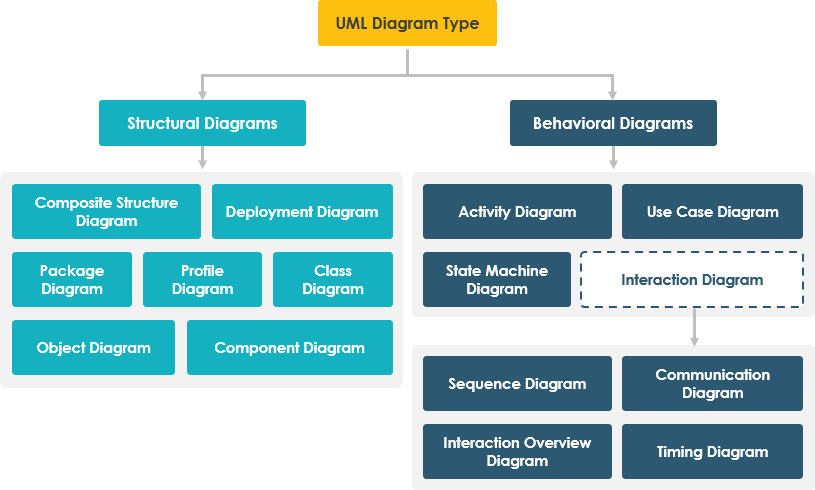
With 14 diagram types split into structural (e.g., Class, Component, Deployment) and behavioral (e.g., Use Case, Sequence, Activity) categories, UML lets you choose the right lens for the problem at hand [[8]].
🔹 Bridge between disciplines
Business analysts sketch processes with Activity diagrams. Developers refine logic with Sequence diagrams. Architects align systems with Deployment diagrams. UML creates a shared vocabulary that transcends roles.
Critics sometimes label UML as "legacy," but that misses the point. UML isn't about drawing pretty pictures for documentation's sake. When applied thoughtfully, it:
Accelerates onboarding by making system intent explicit
Reduces ambiguity in requirements before code is written
Supports model-driven development and code generation
Enables clearer communication with non-technical stakeholders
In an era of microservices, DevOps, and agile iteration, UML's role has evolved—not diminished. Lightweight, targeted modeling (often called "just enough UML") helps teams maintain clarity without overhead [[20]].
UML is less about rigid formalism and more about intentional communication. It's a disciplined way to externalize thinking, align teams, and design systems that scale—technically and organizationally. Whether you're mapping a single feature or orchestrating an enterprise architecture, UML offers a proven, flexible language to make complexity manageable.
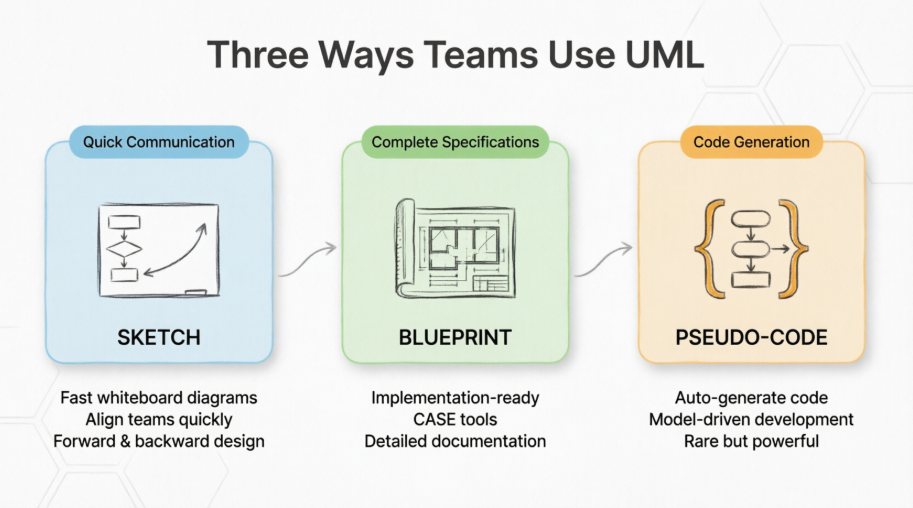
| Approach | Purpose | Best For |
|---|---|---|
| As a sketch | Quick whiteboard diagrams to communicate ideas | Early design discussions, sprint planning, stakeholder alignment |
| As a blueprint | Complete specifications for implementation | Formal documentation, regulatory compliance, large-team coordination |
| As pseudo-code | Generating executable code from models | Domain-specific frameworks, model-driven development pipelines |
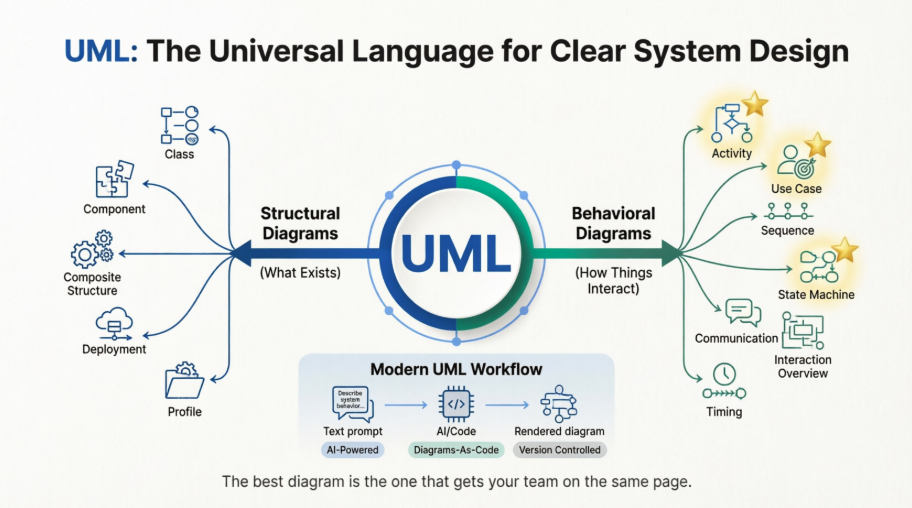
There are 14 UML diagram types, split into two categories: structural (what exists) and behavioral (how things interact). The Pareto Principle applies here—about 20% of diagram types handle 80% of real-world needs.
Behavioral diagrams show how a system behaves over time—actions, interactions, and state changes [[8]].
Best for: Business process modeling, workflow documentation, approval chains
Activity diagrams resemble enhanced flowcharts. They show sequential and parallel activities, decision points, object flows, and swimlanes for role-based responsibilities. Diamond shapes handle branching logic; fork/join bars represent parallel execution.
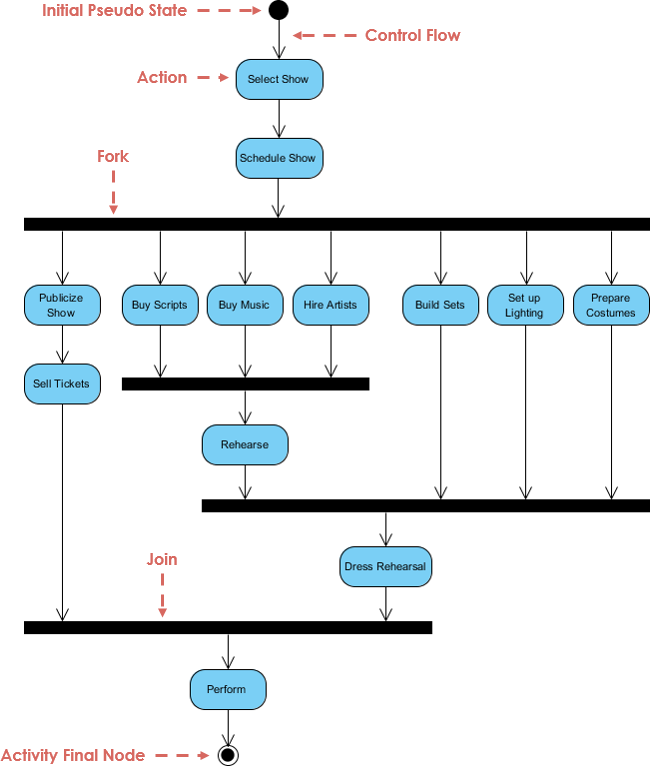
This example illustrates a content publishing workflow: the author writes, the editor reviews, the publisher approves. When revisions are requested, the flow loops back. In business contexts, this pattern is called business process mapping.
When to use it:
✅ Map business processes, workflows, or approval chains
✅ Document decision logic with branching and parallel paths
✅ Clarify role responsibilities using swimlanes
✅ Visualize data flow alongside control flow
Best for: Requirements gathering, scope definition, stakeholder communication
Use case diagrams capture what a system should do from an external perspective—before any implementation details distract the conversation.

Three core components:
Actors: Humans, organizations, or external systems that interact with your solution
Use Cases: Verb-based functional requirements (e.g., "Place Order," "Generate Report")
Relationships: Associations, include/extend dependencies connecting actors to functionality
This inventory management example shows five actors connected to core actions like purchasing stock, quality control, and distribution—simple, clear, and implementation-agnostic.
When to use it:
✅ Define system boundaries and scope early in a project
✅ Capture user requirements in stakeholder-friendly format
✅ Communicate functionality to non-technical audiences
✅ Identify gaps or overlaps in feature coverage
Best for: API design, microservices communication, user journey documentation
Sequence diagrams are arguably the most practical UML diagram for both developers and business analysts. They show the chronological flow of messages between participants—actors, objects, or services—over time.
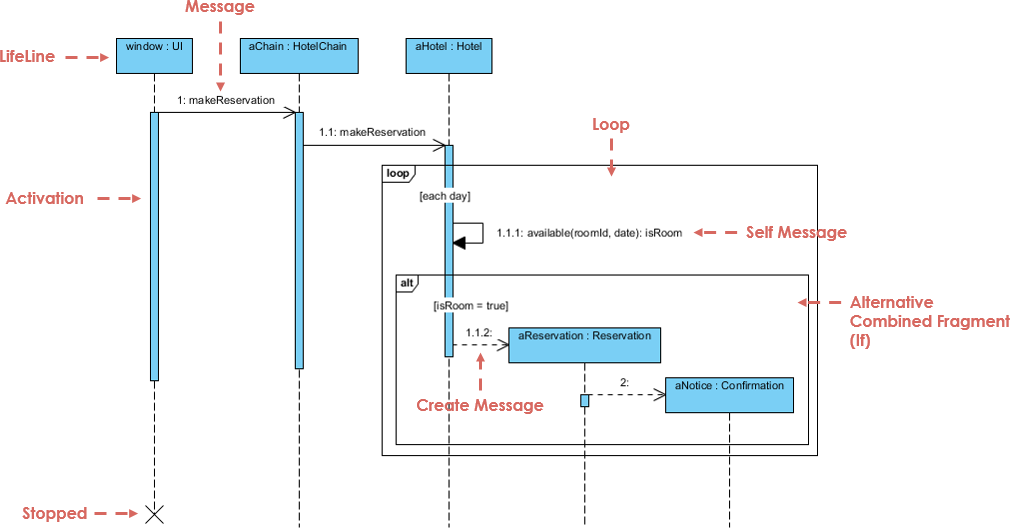
Key elements:
Lifelines: Vertical dashed lines representing each participant
Messages: Horizontal arrows showing method calls, events, or data transfers
Activation bars: Rectangles indicating when an object is processing
Time flows top-to-bottom, making chronology intuitive even for non-technical viewers
When to use it:
✅ Document API interactions and service-to-service communication
✅ Map user journeys across frontend and backend systems
✅ Clarify timing dependencies in microservices architectures [[20]]
✅ Debug complex interaction flows during development
Best for: Modeling object lifecycles, order statuses, user account states
State machine diagrams describe the discrete states an entity can occupy and the events that trigger transitions between them.
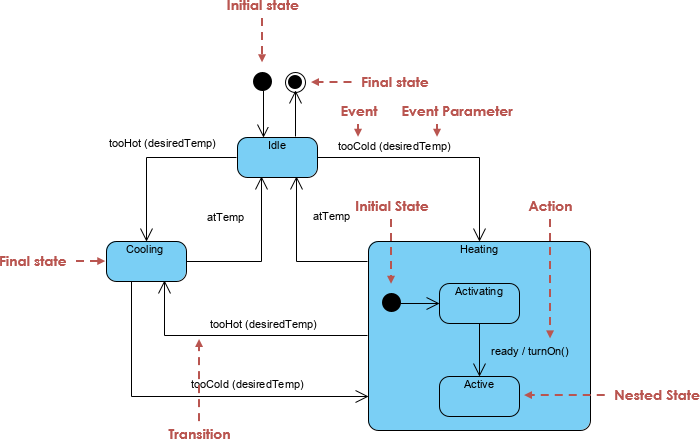
Classic example: A chess game transitions between states like "White to Move," "Black to Move," "Check," and terminal states like "Checkmate" or "Draw"—each triggered by specific events.
When to use it:
✅ Model lifecycle states for orders, accounts, or workflows
✅ Define event-driven behavior with guards and actions
✅ Document validation rules for state transitions
✅ Clarify error handling and recovery paths
Best for: Emphasizing structural relationships over chronological order (niche use)
Formerly called "Collaboration Diagrams" in UML 1.x, communication diagrams show how objects exchange messages using numbered sequences and spatial layout rather than vertical timelines.
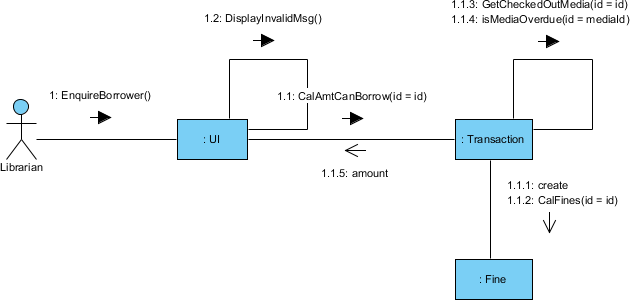
Practical guidance: If choosing between a communication diagram and a sequence diagram for the same scenario, prefer the sequence diagram. It offers better chronological clarity, broader tool support, and wider team familiarity. Communication diagrams shine only when spatial relationships between components matter more than timing—such as visualizing network topology or module dependencies.
When to use it:
⚠️ Rarely—reserve for cases where structural connectivity is the primary concern
✅ Visualizing peer-to-peer messaging patterns in distributed systems
✅ Complementing sequence diagrams with a relationship-focused perspective
Best for: High-level workflow orchestration embedding detailed interactions
Interaction overview diagrams combine the control-flow structure of activity diagrams with embedded references to detailed interaction diagrams (typically sequence diagrams).
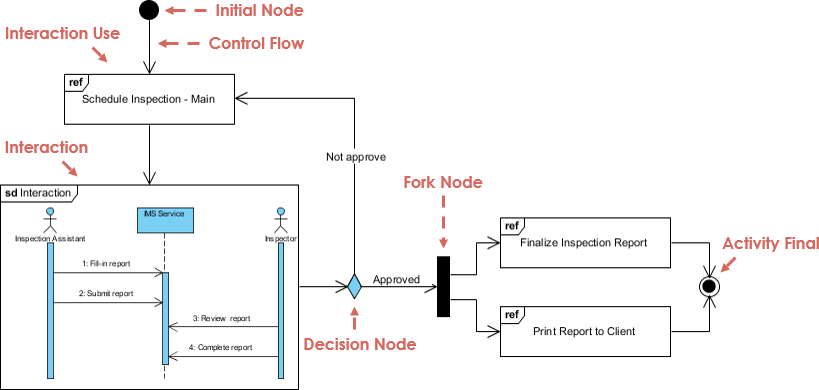
Think of it as a "table of contents" for complex interactions: rectangular frames reference detailed sequence diagrams, while decision nodes and forks manage high-level flow control.
When to use it:
✅ Documenting enterprise workflows requiring both overview and drill-down detail
✅ Orchestrating multi-service processes in microservices architectures
✅ Bridging business process models with technical interaction specs
Best for: Real-time systems, performance-critical workflows, protocol specifications
Timing diagrams focus on when state changes occur along a linear time axis—ideal for scenarios where precise timing constraints matter more than message content.
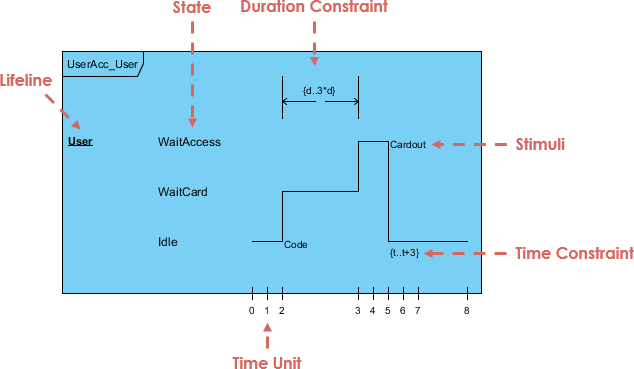
Key components:
Lifelines: Horizontal tracks for each participant
State timelines: Visual representation of state changes over time
Duration/time constraints: Explicit bounds on how long operations may take
Destruction occurrences: Markers indicating when a participant's lifecycle ends
This simplified example shows human growth stages along a timeline. In practice, timing diagrams specify real-time constraints for embedded systems, network protocols, or SLA-bound services.
When to use it:
✅ Modeling real-time or embedded systems with strict timing requirements
✅ Documenting performance SLAs and timeout behaviors
✅ Specifying protocol handshakes with time-bound expectations
Structural diagrams show what exists—the architecture, components, and relationships in a system, independent of time [[8]].
Best for: Object-oriented design documentation, database schema modeling, code generation
Class diagrams are the most widely used UML diagram type. They depict classes, interfaces, attributes, operations, and relationships—making them ideal for documenting object-oriented architectures.
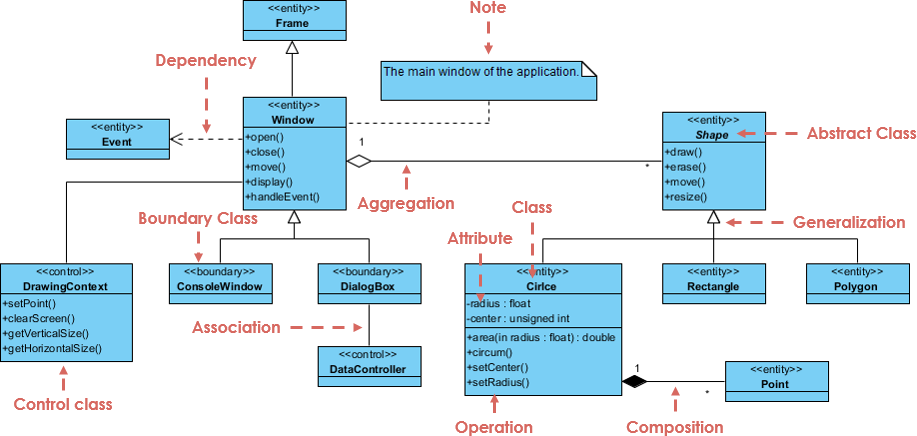
Each class box contains three compartments:
Name: The class identifier (e.g., Account)
Attributes: Data members (e.g., accountNumber: String)
Operations: Methods or behaviors (e.g., withdraw(amount: Double))
Relationships include inheritance (blank arrowheads), associations (solid lines), composition (filled diamonds), and dependencies (dashed arrows).
This ATM example shows CheckingAccount and SavingsAccount inheriting from Account, with Client associated to both—clearly communicating the domain model.
When to use it:
✅ Documenting object-oriented code architecture
✅ Designing database schemas with entity relationships
✅ Generating starter code via model-driven tools
✅ Onboarding new developers to domain concepts
Best for: Validating class designs, testing scenarios with concrete data, debugging relationships
If class diagrams are blueprints, object diagrams are photographs of the house at a specific moment. They show concrete instances of classes with actual attribute values.
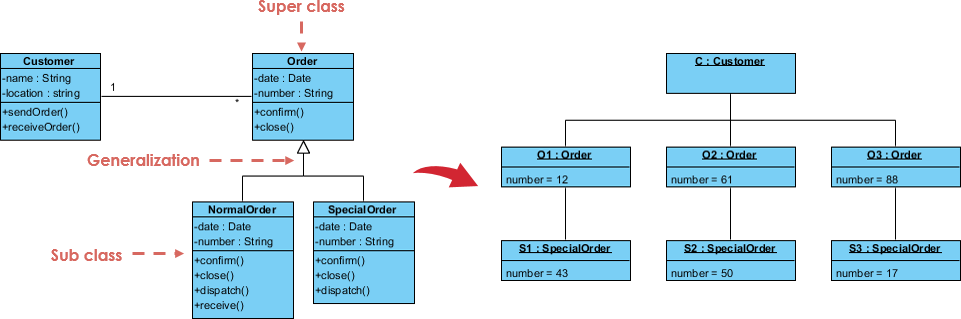
This example instantiates the earlier class diagram: "James" as a Client with a checking balance of $140.67 and savings of $875.69. Notice the design insight: account_number and routing_number differ between account types—suggesting they belong in subclasses, not the generic Account class. Object diagrams surface such abstraction flaws that class diagrams may hide.
When to use it:
✅ Validating class designs with realistic test data
✅ Illustrating example scenarios for documentation or training
✅ Debugging relationship logic with concrete instances
✅ Supporting unit test case design
Best for: Microservices architecture, modular system design, interface contracts
Component diagrams break complex systems into modular, replaceable parts with well-defined interfaces—ideal for documenting service boundaries and dependencies.
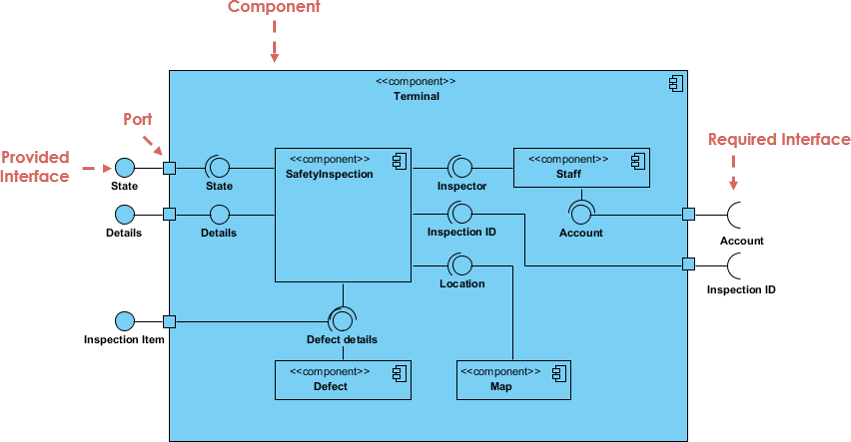
Key elements:
Components: Modular units with provided/required interfaces
Interfaces: Contracts defining interaction points (lollipop/socket notation)
Dependencies: Arrows showing which components rely on others
When to use it:
✅ Documenting microservices boundaries and API contracts
✅ Planning modular refactoring of monolithic systems
✅ Visualizing third-party library integrations
✅ Supporting DevOps pipeline design with deployable units
Best for: Deep-dive architecture reviews, framework development, complex internal collaborations
Composite structure diagrams reveal the internal composition of a class or component—showing parts, ports, and connectors that enable collaboration.
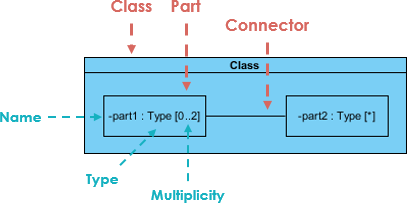
This niche diagram type is rarely needed by business analysts. It shines when modeling complex internal mechanics—such as a subsystem's internal state machine or a framework's plugin architecture.
When to use it:
⚠️ Specialized use cases only
✅ Modeling internal structure of complex components
✅ Documenting framework extension points and plugin architectures
✅ Supporting detailed design reviews for critical subsystems
Best for: Infrastructure planning, DevOps documentation, cloud architecture design
Deployment diagrams map software artifacts to hardware nodes—showing where components run and how they communicate across physical or virtual infrastructure.
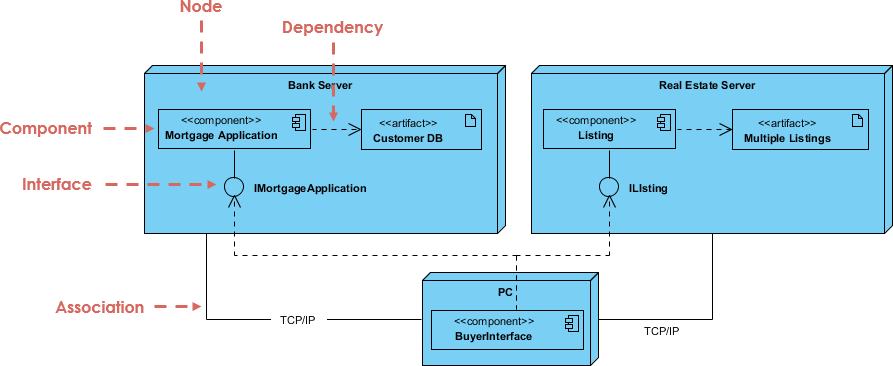
Key elements:
Nodes: Physical or virtual execution environments (servers, containers, devices)
Artifacts: Deployable software units (JARs, containers, scripts)
Communication paths: Network connections with protocols and bandwidth specs
When to use it:
✅ Planning cloud or on-premises deployment topologies
✅ Documenting environment configurations for DevOps teams
✅ Visualizing scalability and failover architectures
✅ Supporting infrastructure-as-code initiatives
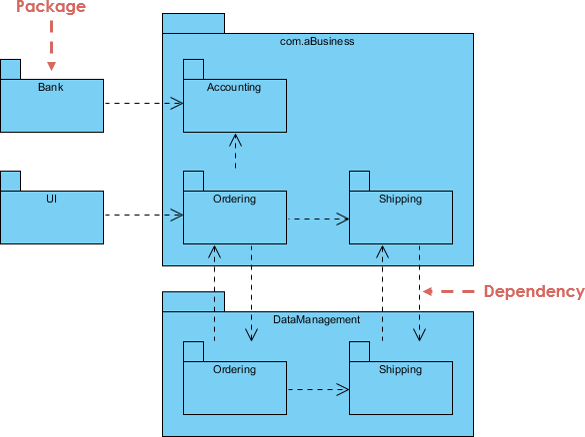
Best for: Organizing large codebases, managing module dependencies, enterprise-scale architecture
Package diagrams group related elements into hierarchical namespaces—like folders for your model—helping manage complexity in large systems.
When to use it:
✅ Structuring large enterprise models for maintainability
✅ Documenting module boundaries and dependency contracts
✅ Supporting incremental refactoring strategies
✅ Communicating architectural layers to stakeholders
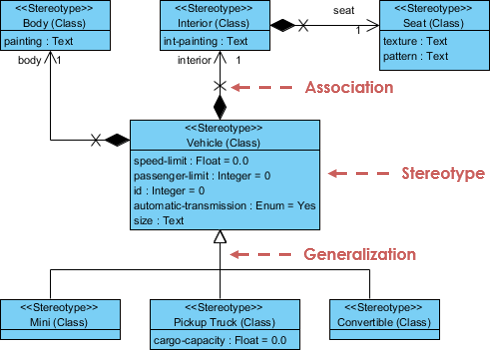
Best for: Domain-specific modeling, industry-standard extensions, custom UML tailoring
Profile diagrams aren't standalone diagrams—they're an extensibility mechanism for customizing UML itself using:
Stereotypes: Create new element types (e.g., «RestController», «Saga»)
Tagged values: Add custom attributes to existing elements
Constraints: Define validation rules (e.g., "balance ≥ 0")
You'll rarely need this unless you're creating custom UML profiles for specialized domains like finance, healthcare, or IoT.
When to use it:
⚠️ Advanced/extensibility scenarios only
✅ Defining industry-specific modeling standards
✅ Creating reusable modeling templates for enterprise teams
✅ Integrating UML with domain-specific languages (DSLs)
Stop trying to memorize all 14 types. Focus on the handful that solve your immediate problem. Here's a pragmatic reference:
| Your Goal | Recommended Diagram | Why It Works |
|---|---|---|
| Map a business process or workflow | Activity Diagram | Shows flow control, branching, parallel paths, and role responsibilities via swimlanes |
| Define user requirements or system scope | Use Case Diagram | Clarifies functionality from an external perspective before implementation begins |
| Show time-ordered interactions between components | Sequence Diagram | Chronological message flow is intuitive for developers and stakeholders alike |
| Document object-oriented architecture | Class Diagram | Industry standard for modeling entities, relationships, and behavior |
| Validate design with concrete examples | Object Diagram | Catches abstraction flaws hidden in class-level models |
| Plan infrastructure or deployment topology | Deployment Diagram | Maps software artifacts to hardware nodes and communication paths |
| Model state-driven behavior or lifecycle | State Machine Diagram | Explicitly defines states, transitions, and event handling logic |
| Design modular or microservices architecture | Component Diagram | Clarifies service boundaries, interfaces, and dependencies |
Everything else? Learn it just-in-time when your project demands it. Depth beats breadth.
Smarter agents without better workflows just mean faster confusion. Right now, the bottleneck isn't AI capability—it's the structured workflows those agents need to follow. Fortunately, diagramming tools have evolved dramatically.
You no longer need to drag and drop shapes manually. Here's the modern 2026 workflow:
Describe intent in plain English
"Create a sequence diagram showing OAuth 2.0 login flow with token refresh"
AI generates diagram-as-code
Tools like GitHub Copilot, Claude, or Visual Paradigm AI output Mermaid or PlantUML syntax [[28]][[30]]
Code renders to visual diagram
Instant preview, version-controlled alongside source code, embeddable in documentation
✅ Diagrams-as-Code in CI/CD
Teams store Mermaid/PlantUML files in Git repositories. Diagrams auto-regenerate during builds—eliminating stale Visio files from 2019.
✅ AI Agents Executing UML Workflows
Process definition matters more than ever. A UML Activity diagram isn't just documentation—it's an executable specification that AI agents can follow. AI doesn't fix broken processes; it scales them. Getting the diagram right is the prerequisite, not the afterthought.
✅ Model Context Protocol (MCP) Integration
Specialized UML MCP servers enable AI agents to generate, analyze, and refine diagrams through standardized interfaces—turning diagrams into living, queryable artifacts.
✅ Semantic Backplanes in Modeling Tools
Modern tools like Visual Paradigm maintain a single semantic model behind all diagrams. Change a class in the Class Diagram, and Sequence, Component, and Deployment views auto-update—ensuring consistency across perspectives [[8]].
UML remains one of the most powerful tools for bringing clarity to complexity. While the full specification includes 14 diagram types, most practitioners will find immense value in mastering just four or five:
Activity diagrams for workflows
Use case diagrams for requirements
Sequence diagrams for interactions
Class diagrams for architecture
The real power of UML isn't in the formalism—it's in the shared understanding it creates. When teams sit down to draw an activity diagram, disagreements about process flow often resolve within minutes. Bottlenecks become visible. Handoffs get clarified. Everyone leaves with the same mental model.
As AI tools transform how we create and consume diagrams, UML is becoming more accessible than ever. Natural language prompts can generate production-ready diagram code. Version control treats diagrams like any other artifact. And intelligent agents can execute workflows defined in UML activity diagrams.
Whether you're a developer documenting microservices, a business analyst mapping approval workflows, or a product manager aligning stakeholders, UML gives you a common language. Start with the diagrams that solve your immediate problem. Learn the rest as you need them. And remember: the best diagram is the one that gets your team on the same page.
UML 2.5.1 Specification (OMG) – Official language definition [[9]]
Overview of the 14 UML Diagram Types – Complete reference with use cases
Activity Diagram Best Practices – Workflow modeling techniques
Sequence Diagrams for Microservices – Modern interaction modeling [[20]]
AI-Powered UML Generation – Natural language to diagram workflows [[28]]
Free UML Tool: Visual Paradigm Community Edition – Full-featured modeling for non-commercial use
Mermaid Live Editor – Open-source diagram-as-code renderer
PlantUML Documentation – Text-based UML syntax reference
💡 Pro Tip: Bookmark this guide. When your next project kicks off, revisit the "Which Diagram Should You Use?" table. Start small, iterate often, and let clarity—not completeness—drive your modeling efforts.