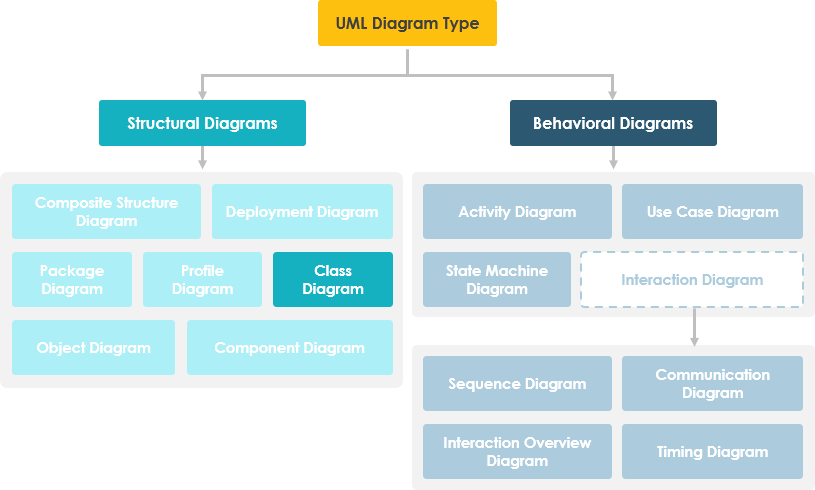
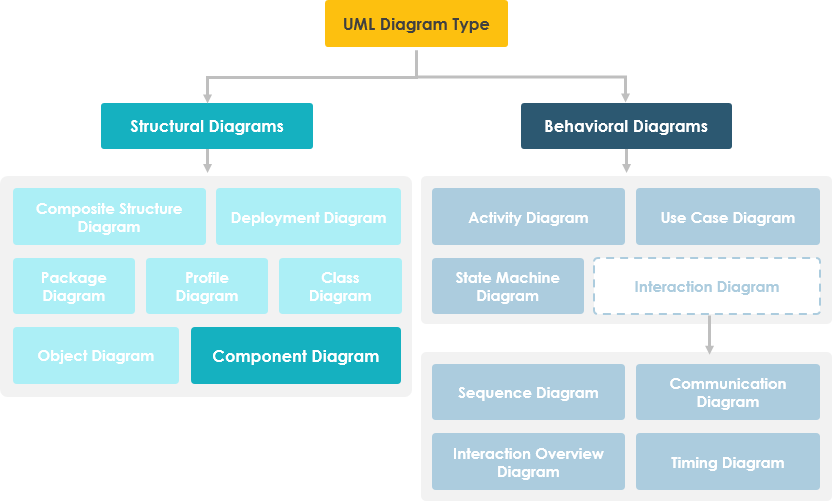
In the complex world of software architecture and system design, Unified Modeling Language (UML) serves as a universal blueprint language that helps teams visualize, specify, construct, and document software systems. Among the thirteen UML diagram types, two stand out as particularly essential for structural modeling: Class Diagrams and Component Diagrams.
While both diagrams describe static structures, they serve fundamentally different purposes and operate at distinct levels of abstraction. Class diagrams zoom into the internal logic of your code—defining classes, their attributes, operations, and relationships. Component diagrams, conversely, pull back to show how modular pieces of your system fit together, interact, and deploy in the real world.
Understanding when to use each diagram type—and how they complement one another—is crucial for effective communication among developers, architects, business analysts, and stakeholders. This comprehensive guide breaks down both diagram types, explores their core concepts, and provides practical guidance on selecting the right tool for your modeling needs.
In software engineering, a class diagram in the Unified Modeling Language (UML) is a type of static structure diagram that describes the structure of a system by showing the system's classes, their attributes, operations (or methods), and the relationships among objects.
Shows static structure of classifiers in a system
Diagram provides a basic notation for other structure diagrams prescribed by UML
Helpful for developers and other team members too
Business Analysts can use class diagrams to model systems from a business perspective
A UML class diagram is made up of:
A set of classes and
A set of relationships between classes
A description of a group of objects all with similar roles in the system, which consists of:
Structural features (attributes) define what objects of the class "know"
Represent the state of an object of the class
Are descriptions of the structural or static features of a class
Behavioral features (operations) define what objects of the class "can do"
Define the way in which objects may interact
Operations are descriptions of behavioral or dynamic features of a class
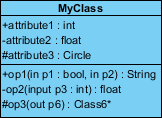
A class notation consists of three parts:
Class Name
The name of the class appears in the first partition.
Class Attributes
Attributes are shown in the second partition.
The attribute type is shown after the colon.
Attributes map onto member variables (data members) in code.
Class Operations (Methods)
Operations are shown in the third partition. They are services the class provides.
The return type of a method is shown after the colon at the end of the method signature.
The return type of method parameters is shown after the colon following the parameter name.
Operations map onto class methods in code

The graphical representation of the class - MyClass as shown above:
MyClass has 3 attributes and 3 operations
Parameter p3 of op2 is of type int
op2 returns a float
op3 returns a pointer (denoted by a *) to Class6
A class may be involved in one or more relationships with other classes. A relationship can be one of the following types: (Refer to the figure on the right for the graphical representation of relationships).
| Relationship Type | Graphical Representation |
|---|---|
Inheritance (or Generalization):
|
 |
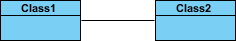
Simple Association:
|
 |
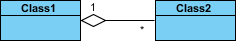
| Aggregation: A special type of association. It represents a "part of" relationship.
|
 |
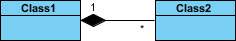
| Composition: A special type of aggregation where parts are destroyed when the whole is destroyed.
|
 |
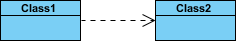
Dependency:
|
 |
Names of relationships are written in the middle of the association line.
Good relation names make sense when you read them out loud:
"Every spreadsheet contains some number of cells",
"an expression evaluates to a value"
They often have a small arrowhead to show the direction in which direction to read the relationship, e.g., expressions evaluate to values, but values do not evaluate to expressions.
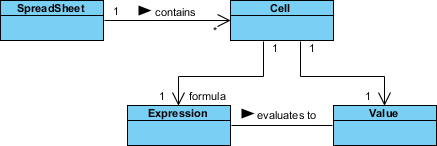
A role is a directional purpose of an association.
Roles are written at the ends of an association line and describe the purpose played by that class in the relationship.
E.g., A cell is related to an expression. The nature of the relationship is that the expression is the formula of the cell.
The arrows indicate whether, given one instance participating in a relationship, it is possible to determine the instances of the other class that are related to it.
The diagram above suggests that,
Given a spreadsheet, we can locate all of the cells that it contains, but that
we cannot determine from a cell in what spreadsheet it is contained.
Given a cell, we can obtain the related expression and value, but
given a value (or expression) we cannot find the cell of which those are attributes.
In object-oriented design, there is a notation of visibility for attributes and operations. UML identifies four types of visibility: public, protected, private, and package.
The +, -, # and ~ symbols before an attribute and operation name in a class denote the visibility of the attribute and operation.
denotes public attributes or operations
- denotes private attributes or operations
# denotes protected attributes or operations
~ denotes package attributes or operations
In the example above:
attribute1 and op1 of MyClassName are public
attribute3 and op3 are protected.
attribute2 and op2 are private.
Access for each of these visibility types is shown below for members of different classes.
| Access Right | public (+) | private (-) | protected (#) | Package (~) |
|---|---|---|---|---|
| Members of the same class | yes | yes | yes | yes |
| Members of derived classes | yes | no | yes | yes |
| Members of any other class | yes | no | no | in same package |
How many objects of each class take part in the relationships and multiplicity can be expressed as:
Exactly one - 1
Zero or one - 0..1
Many - 0..* or *
One or more - 1..*
Exact Number - e.g. 3..4 or 6
Or a complex relationship - e.g. 0..1, 3..4, 6.* would mean any number of objects other than 2 or 5
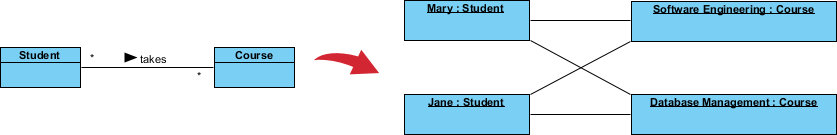
Requirement: A Student can take many Courses and many Students can be enrolled in one Course.
In the example below, the class diagram (on the left), describes the statement of the requirement above for the static model while the object diagram (on the right) shows the snapshot (an instance of the class diagram) of the course enrollment for the courses Software Engineering and Database Management respectively)
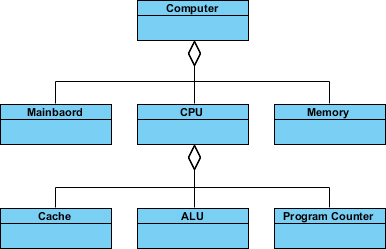
An aggregation is a special case of association denoting a "consists-of" hierarchy
The aggregate is the parent class, the components are the children classes
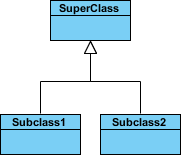
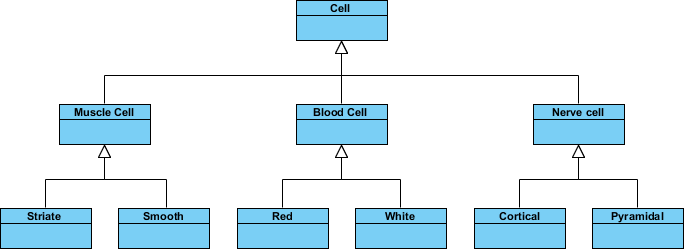
Inheritance is another special case of an association denoting a "kind-of" hierarchy
Inheritance simplifies the analysis model by introducing a taxonomy
The child classes inherit the attributes and operations of the parent class.
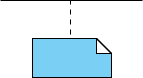
A class diagram may also have notes attached to classes or relationships. Notes are shown in grey.
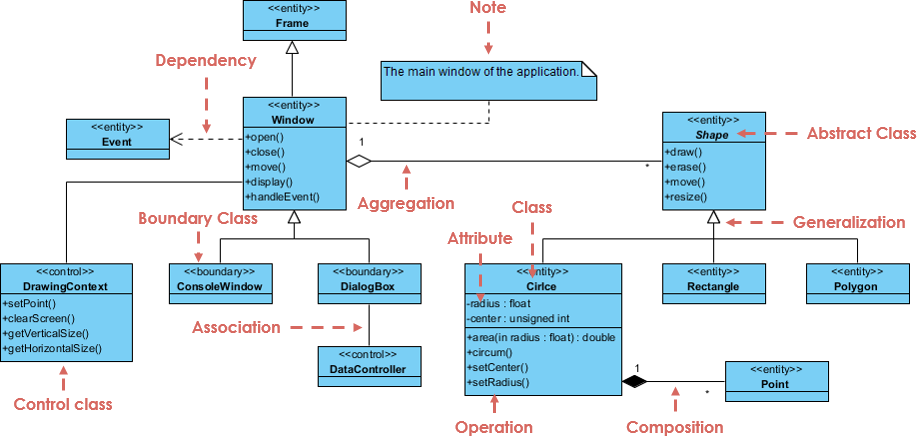
In the example above, we can interpret the meaning of the above class diagram by reading through the points as following:
Shape is an abstract class. It is shown in Italics.
Shape is a superclass. Circle, Rectangle and Polygon are derived from Shape. In other words, a Circle is-a Shape. This is a generalization / inheritance relationship.
There is an association between DialogBox and DataController.
Shape is part-of Window. This is an aggregation relationship. Shape can exist without Window.
Point is part-of Circle. This is a composition relationship. Point cannot exist without a Circle.
Window is dependent on Event. However, Event is not dependent on Window.
The attributes of Circle are radius and center. This is an entity class.
The method names of Circle are area(), circum(), setCenter() and setRadius().
The parameter radius in Circle is an in parameter of type float.
The method area() of class Circle returns a value of type double.
The attributes and method names of Rectangle are hidden. Some other classes in the diagram also have their attributes and method names hidden.
Building a robust static structure doesn't have to start from a blank canvas. Whether you are using our Desktop modeler for precision editing or our AI Ecosystem for rapid generation, Visual Paradigm automates the path from requirements to Class Diagrams.
VP Desktop: Generate Class Diagrams via AI and use our professional modeling suite for advanced refinement.
AI Chatbot: Simply describe your domain and let the AI Chatbot generate and touch up your class structures.
OpenDocs: Embed AI-generated Class Diagrams directly into your OpenDocs pages for live documentation.
⚡ AI Class Diagram Wizard: Step-by-step assistant for classes, attributes, and operations.
🔄 Use Case Studio: Automatically extracts domain classes from behavior descriptions.
🚀 Agilien: Bridge User Stories/Epics directly to structural UML models.
💾 DB Modeler AI: Generates conceptual Domain Class Diagrams for database design.
🏛️ MVC Architecture: Generates specialized Controller Class Diagrams.
Explore how to master Class Diagrams with AI:
AI Class Diagram Guide Full AI Ecosystem
Inevitably, if you are modeling a large system or a large business area, there will be numerous entities you must consider. Should we use multiple or a single class diagram for modeling the problem? The answer is:
Instead of modeling every entity and its relationships on a single class diagram, it is better to use multiple class diagrams.
Dividing a system into multiple class diagrams makes the system easier to understand, especially if each diagram is a graphical representation of a specific part of the system.
We can use class diagrams in different development phases of a software development lifecycle and typically by modeling class diagrams in three different perspectives (levels of detail) progressively as we move forward:
Conceptual perspective: The diagrams are interpreted as describing things in the real world. Thus, if you take the conceptual perspective you draw a diagram that represents the concepts in the domain under study. These concepts will naturally relate to the classes that implement them. The conceptual perspective is considered language-independent.
Specification perspective: The diagrams are interpreted as describing software abstractions or components with specifications and interfaces but with no commitment to a particular implementation. Thus, if you take the specification perspective we are looking at the interfaces of the software, not the implementation.
Implementation perspective: The diagrams are interpreted as describing software implementations in a particular technology and language. Thus, if you take the implementation perspective we are looking at the software implementation.
UML Component diagrams are used in modeling the physical aspects of object-oriented systems that are used for visualizing, specifying, and documenting component-based systems and also for constructing executable systems through forward and reverse engineering. Component diagrams are essentially class diagrams that focus on a system's components that often used to model the static implementation view of a system.
Are you looking for a Free UML tool for learning UML faster, easier and quicker? Visual Paradigm Community Edition is a UML software that supports all UML diagram types. It is an international award-winning UML modeler, and yet it is easy-to-use, intuitive & completely free.
Free Download
A component diagram breaks down the actual system under development into various high levels of functionality. Each component is responsible for one clear aim within the entire system and only interacts with other essential elements on a need-to-know basis.

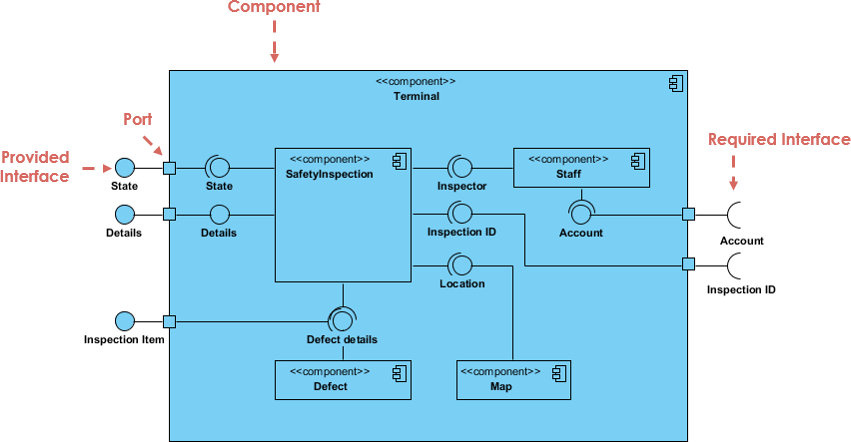
The example above shows the internal components of a larger component:
The data (account and inspection ID) flows into the component via the port on the right-hand side and is converted into a format the internal components can use. The interfaces on the right are known as required interfaces, which represents the services the component needed in order to carry out its duty.
The data then passes to and through several other components via various connections before it is output at the ports on the left. Those interfaces on the left are known as provided interface, which represents the services to deliver by the exhibiting component.
It is important to note that the internal components are surrounded by a large 'box' which can be the overall system itself (in which case there would not be a component symbol in the top right corner) or a subsystem or component of the overall system (in this case the 'box' is a component itself).
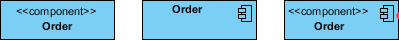
A component represents a modular part of a system that encapsulates its contents and whose manifestation is replaceable within its environment. In UML 2, a component is drawn as a rectangle with optional compartments stacked vertically. A high-level, abstracted view of a component in UML 2 can be modeled as:
A rectangle with the component's name
A rectangle with the component icon
A rectangle with the stereotype text and/or icon
Component diagrams visualize the modular parts and physical manifestation of your system. Using Visual Paradigm's AI Chatbot, you can instantly brainstorm system architectures, identify provided/required interfaces, and generate initial component diagrams through a simple conversational interface.
Simply describe your modules, microservices, or database structures to the chatbot. It will help you define:
Modular Boundaries: Identify which parts of your system should be encapsulated as components.
Dependency Mapping: Visualize how different executables and libraries interact within your release.
Learn more about our AI-driven modeling ecosystem:
AI Component Guide All AI Tools
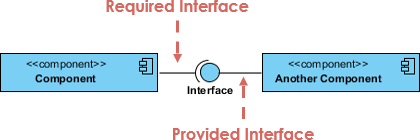
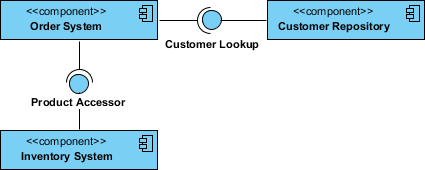
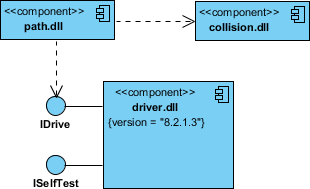
In the example below shows two type of component interfaces:
Provided interface symbols with a complete circle at their end represent an interface that the component provides - this "lollipop" symbol is shorthand for a realization relationship of an interface classifier.
Required Interface symbols with only a half circle at their end (a.k.a. sockets) represent an interface that the component requires (in both cases, the interface's name is placed near the interface symbol itself).
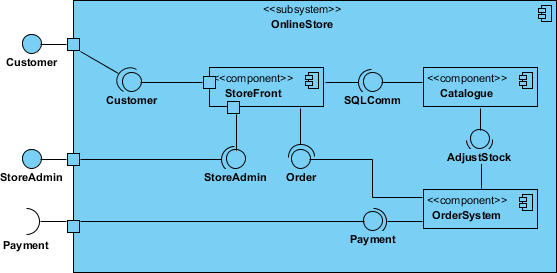
The subsystem classifier is a specialized version of a component classifier. Because of this, the subsystem notation element inherits all the same rules as the component notation element. The only difference is that a subsystem notation element has the keyword of subsystem instead of component.
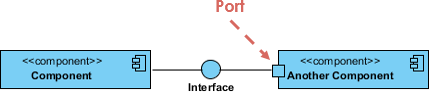
Ports are represented using a square along the edge of the system or a component. A port is often used to help expose required and provided interfaces of a component.
Graphically, a component diagram is a collection of vertices and arcs and commonly contain components, interfaces and dependency, aggregation, constraint, generalization, association, and realization relationships. It may also contain notes and constraints.
| Relationships | Notation |
|---|---|
Association:
|
 |
Composition:
|
 |
Aggregation
|
 |
Constraint
|
 |
Dependency
|
 |
Links:
|
 |
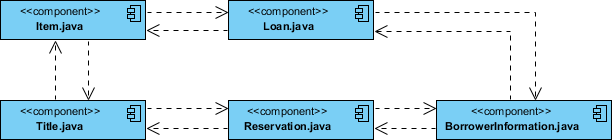
Either by forward or reverse engineering, identify the set of source code files of interest and model them as components stereotyped as files.
For larger systems, use packages to show groups of source code files.
Consider exposing a tagged value indicating such information as the version number of the source code file, its author, and the date it was last changed. Use tools to manage the value of this tag.
Model the compilation dependencies among these files using dependencies. Again, use tools to help generate and manage these dependencies.
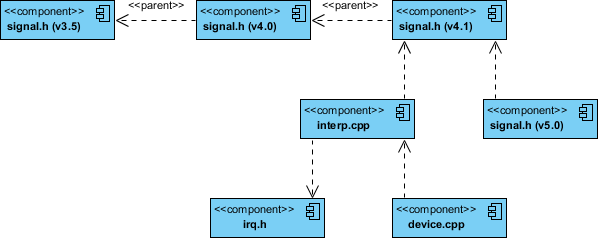
Identify the set of components you'd like to model. Typically, this will involve some or all the components that live on one node, or the distribution of these sets of components across all the nodes in the system.
Consider the stereotype of each component in this set. For most systems, you'll find a small number of different kinds of components (such as executables, libraries, tables, files, and documents). You can use the UML's extensibility mechanisms to provide visual cues(clues) for these stereotypes.
For each component in this set, consider its relationship to its neighbors. Most often, this will involve interfaces that are exported (realized) by certain components and then imported (used) by others. If you want to expose the seams in your system, model these interfaces explicitly. If you want your model at a higher level of abstraction, elide these relationships by showing only dependencies among the components.
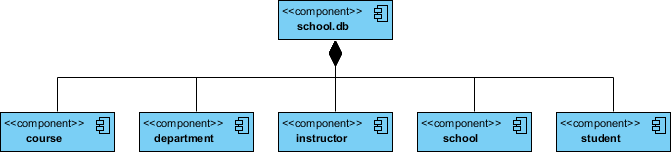
Identify the classes in your model that represent your logical database schema.
Select a strategy for mapping these classes to tables. You will also want to consider the physical distribution of your databases. Your mapping strategy will be affected by the location in which you want your data to live on your deployed system.
To visualize, specify, construct, and document your mapping, create a component diagram that contains components stereotyped as tables.
Where possible, use tools to help you transform your logical design into a physical design.
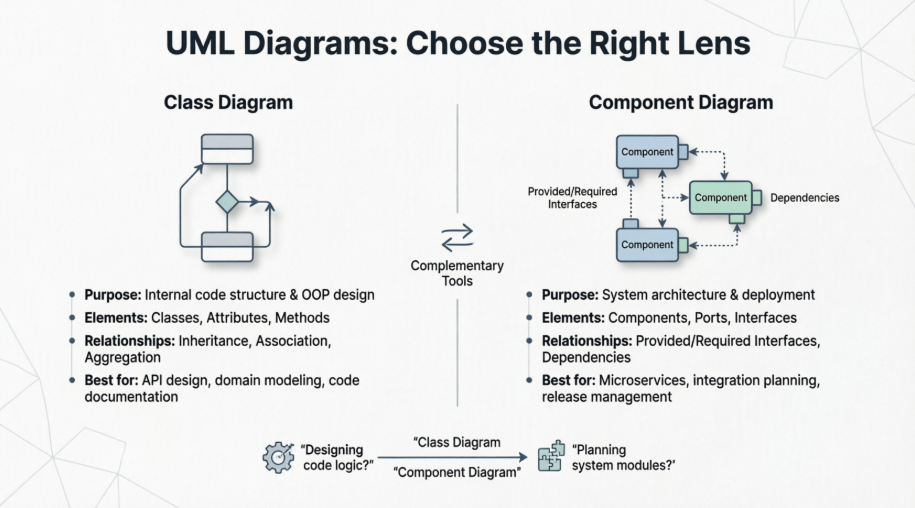
The primary difference is the level of abstraction: Class diagrams describe the internal structure and logic of a system (the "blueprints" for coding), while Component diagrams describe the high-level physical or functional modules and how they interact (the "building blocks" of the architecture).
Purpose: Shows the attributes, methods, and relationships of individual objects.
Elements: Classes, Interfaces, Enumerations.
Relationships: Association, Aggregation, Composition, Generalization (Inheritance).
Purpose: Shows how a system is divided into physical components (like DLLs, executables, or services) and the dependencies between them.
Elements: Components (represented by a box with two small rectangles on the side), Ports, Interfaces.
Relationships: "Provided" interfaces (Lollipop) and "Required" interfaces (Socket).
Class Diagrams: Focus on domain logic. Use them to communicate the "what" and "how" of your code. Avoid over-complicating them with every single private helper method; stick to the public API and key relationships.
Component Diagrams: Focus on system architecture. Use them to show how different parts of the system are deployed or how third-party libraries integrate. They are excellent for explaining high-level dependencies to stakeholders.
Traceability: Ensure that your components can be mapped back to classes. A single component often encapsulates a package of related classes.
Visual Paradigm provides specific features to streamline both types:
Model Explorer: Use this to maintain a single "source of truth." You can drag a class from the explorer into multiple diagrams without duplicating the data.
Resource Catalog: When you select an element, click the tiny icon at the top right to quickly drag out and create related elements (like an interface or a subclass).
Code Engineering: You can use the Java/C++ Code Generation tool to turn your Class Diagrams directly into source code, or reverse-engineer existing code back into a diagram.
Sub-diagrams: You can "drill down" by right-clicking a Component and creating a Class Diagram as a sub-diagram to show its internal implementation.
| Scenario | Recommended Diagram | Why |
|---|---|---|
| Designing object-oriented code structure | Class Diagram | Captures classes, attributes, methods, and relationships at the code level |
| Planning system modularization or microservices | Component Diagram | Shows how independent modules interact and depend on each other |
| Documenting API contracts between teams | Component Diagram | Interfaces and ports clearly define service boundaries |
| Refactoring legacy code | Class Diagram | Helps visualize existing class relationships and identify coupling |
| Planning deployment architecture | Component Diagram | Maps components to physical or logical deployment units |
| Teaching OOP concepts | Class Diagram | Illustrates inheritance, polymorphism, and encapsulation clearly |
| Integrating third-party libraries | Component Diagram | Shows external dependencies and interface requirements |
| Database schema design (conceptual) | Class Diagram | Models entities and relationships before physical mapping |
| Database schema design (physical) | Component Diagram | Maps logical classes to physical tables and storage components |
Choosing between a Class Diagram and a Component Diagram isn't about picking the "better" option—it's about selecting the right lens for the problem you're solving. Class diagrams excel when you need to design, document, or communicate the internal logic of your software at the code level. They are indispensable for object-oriented design, API specification, and ensuring your codebase maintains clean relationships and responsibilities.
Component diagrams, on the other hand, shine when you need to architect, deploy, or explain how larger pieces of your system fit together. They are essential for microservices design, integration planning, release management, and stakeholder communication about system boundaries and dependencies.
The most effective software teams use both diagrams complementarily: starting with conceptual class diagrams to model domain logic, then evolving to component diagrams to plan deployment and integration. By understanding the distinct purposes and strengths of each diagram type, you can create clearer documentation, foster better team alignment, and build more maintainable, scalable systems.
Remember: great architecture isn't just about the tools you use—it's about using the right tool at the right time. Let Class Diagrams guide your code, and let Component Diagrams guide your system.