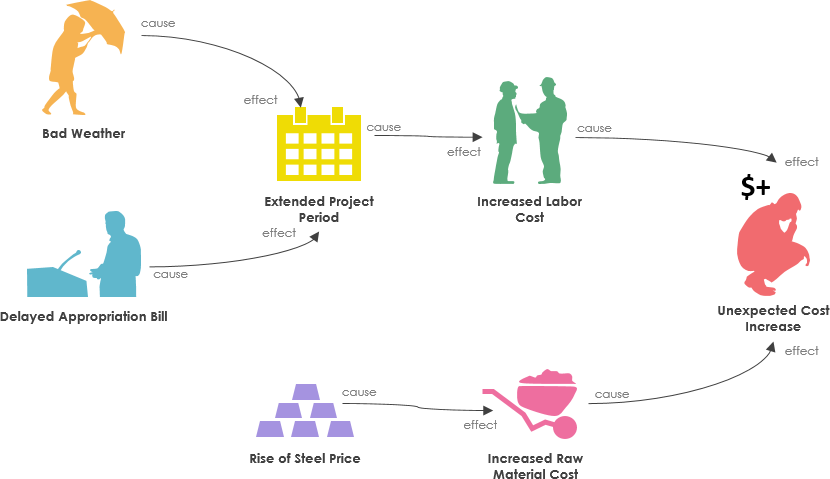
Cause and effect is a relationship between events or things, where one is the result of the other or others. This is a combination of action and reaction. A cause-and-effect analysis generates and sorts hypotheses about possible causes of problems within a process by asking participants to list all of the possible causes and effects for the identified problem.

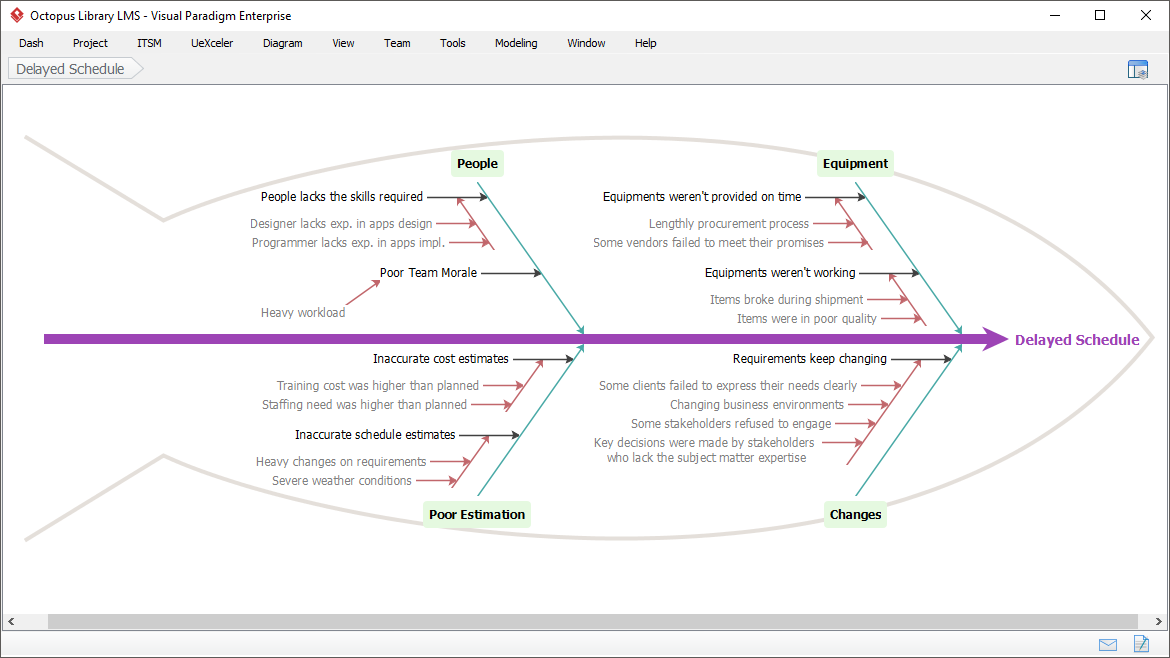
Cause and effect analysis is often conducted by drawing cause-and-effect diagrams (also known as Fishbone Diagram), which organize a large amount of information by showing links between events and their potential or actual causes and provide a means of generating ideas about why the problem is occurring and possible effects of that cause.
The cause-and-effect analysis allows problem solvers to broaden their thinking and look at the overall picture of a problem. Cause-and-effect diagrams can reflect either cause that blocks the way to the desired state or helpful factors needed to reach the desired state.
Fishbone Diagram (also known as Cause and Effect Diagram or Ishikawa Diagram) It visually displays multiple causes for a problem and helps us to identify stakeholder ideas about the causes of problems which Allows us to immediately categorize ideas into themes for analysis or further data gathering. People often use the 5-whys technique in conjunction with the fishbone diagram.

A cause-and-effect analysis stimulates and broadens thinking about potential or real causes and facilitates further examination of individual causes. Because everyone’s ideas can find a place on the diagram, a cause-and-effect analysis helps to generate consensus about causes. It can help to focus attention on the process where a problem is occurring and to allow for constructive use of facts revealed by reported events.
The 5 Whys can be used individually or as a part of the fishbone (also known as the cause and effect or Ishikawa) diagram. The fishbone diagram helps you explore all potential or real causes that result in a single defect or failure. Once all inputs are established on the fishbone, you can use the 5 Whys technique to drill down to the root causes.
For example:
Statement – Your car stops in the middle of the road.
1. Why did your car stop?
2. Why did it run out of gas?
3. Why didn’t you buy any gas this morning?
4. Why didn’t you have any money?
5. Why did you lose your money in last night’s poker game?
As you can see, in both examples the final Why leads the team to a statement (root cause) that the team can take action upon. It is much quicker to come up with a system that keeps the sales director updated on recent sales or teach a person to “bluff” a hand than it is to try to directly solve the stated problems above without further investigation.