Want to create a Venn Diagram? We will provide you with an introduction to Venn Diagrams and let you know how you can create a Venn Diagram with our Venn Diagram software.

Venn Diagram, also called Primary Diagram, Logic Diagram or Set Diagram, is widely used in mathematics, statistics, logic, computer science and business analysis for representing the logical relationships between two or more sets of data. A Venn Diagram involves overlapping circles, which present how things are being organized, their commonality and differences.

Venn diagrams are effective in displaying the similarities or the differences between multiple data set (usually two to four). Venn diagrams also describe the result of unifying several data groups. They can also describe the overlapping responsibilities of two organizations/teams.
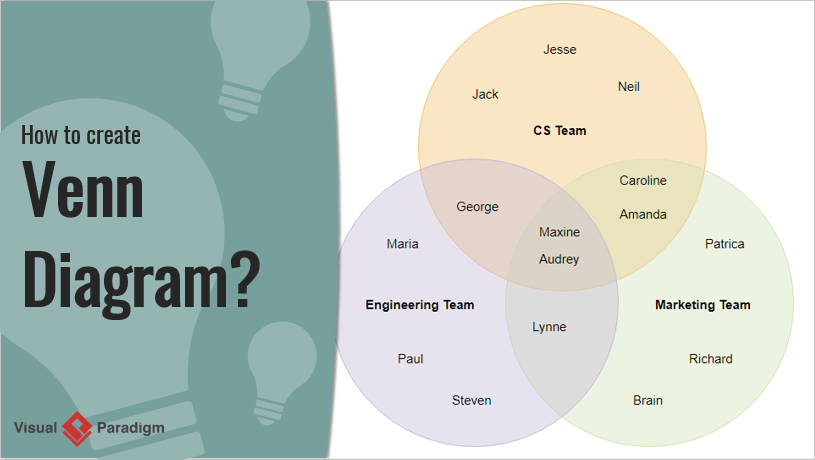
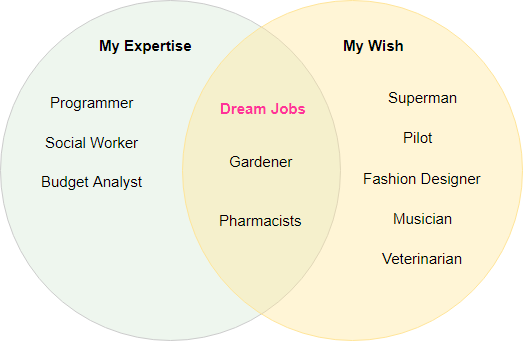
Listed below are some Venn diagram examples. As you can see, Venn diagrams consist of overlapped oval shapes, showing the content of the data sets as well as the data that co-exists in multiple groups.
Note that instead of ovals, Venn Diagrams can also be formed with triangles, rectangles, squares, and other shapes, although uncommon.

