快速繪製因果圖(又稱魚骨圖 / 石川圖)

因果圖有時被稱為魚骨圖,因為它們類似於魚的骨骼、頭部、脊柱和骨骼。因果圖對於探索可能導致或促成特定問題(或影響)的所有潛在因素非常有用。它經常被用作頭腦風暴的有效溝通工具,尤其是在處理複雜問題時。

魚的骨頭將自動定位,魚體將隨著內容的更新而增長和縮小。您無需手動更新佈局。

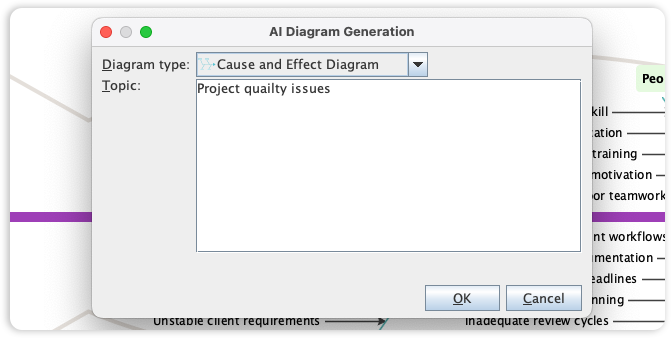
Visual Paradigm's Cause and Effect Diagram tool is a vital resource for root cause analysis, helping teams visualize the complex relationships between potential factors and a specific problem. We are now enhancing your problem-solving capabilities by integrating Fishbone Diagram support into our AI Diagram Generator, turning brainstorming sessions into structured models instantly.
This capability allows you to generate a complete Cause and Effect Diagram-featuring the characteristic head, spine, and categorized "bones"-from a simple description of your challenge. By simply stating the effect you are investigating, the AI identifies and organizes potential contributing factors across multiple dimensions. This removes the manual effort of plotting nodes and lines, allowing your team to focus on critical analysis and finding effective solutions.