Easy-to-use Radar Chart software tool to create any kind of radar chart and spider chart.

What is the capability level of your development team? Which part of your team requires strengthening or optimization? What is the focus areas that will support your development activities? By drawing a radar chart (a.k.a spider chart), you can easily find answers to all these questions.


Create colored stages (aka. rings) for items to be examined. Example use: Stages for each of the competitor to be assessed in competitive analysis.

Drag-and-drop to adjust the score of variable. As you drag, the score will be shown and updated on-the-fly.
Group similar variables into process areas. Apply different color code for visual differentiation.
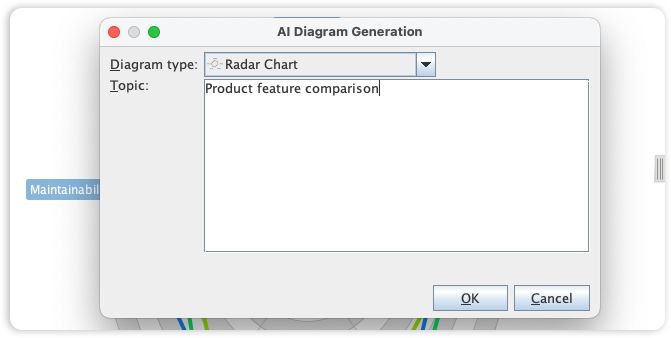
Visual Paradigm's Radar Chart tool is essential for visualizing multi-variable data and performance metrics. We have now streamlined the data-plotting process by integrating full Radar Chart support into our AI Diagram Generator, allowing you to transform complex comparisons into clear, circular web diagrams instantly.
This capability allows you to generate professional Radar Charts from simple text descriptions, entirely skipping the manual calculation of axes and plotting of data points. By simply describing your metrics-such as performance profiles, product comparisons, or skill assessments-the AI automatically constructs a balanced, structurally sound chart, enabling you to focus on data interpretation and strategic insights rather than manual drafting.