Use Case Diagram
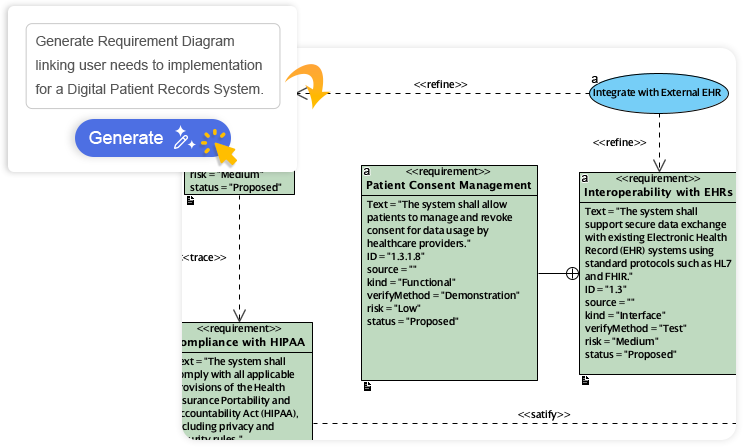
Describe what you need, and our AI builds it for you — perfectly laid out, beautifully designed, and ready to refine.

Turn your ideas into diagrams instantly with AI - just type what you need and get accurate, presentation-ready diagrams without templates or manual drawing.

AI generates clean, balanced, and readable diagrams with perfect spacing and alignment, so you can focus on ideas instead of rearranging shapes.
Our AI interprets your intent, fills in missing details, and suggests relationships to expand your ideas into structured, accurate diagrams.


Refine and customize diagrams with full control - move shapes, rename elements, and change styles while AI gives you a head start.
Diagram generation is a key pillar of the Visual Paradigm AI-Powered Visual Modeling Ecosystem. It's not just a standalone tool - it's a connected workspace where your ideas transform into professional-grade documentation.
Explore the Full Ecosystem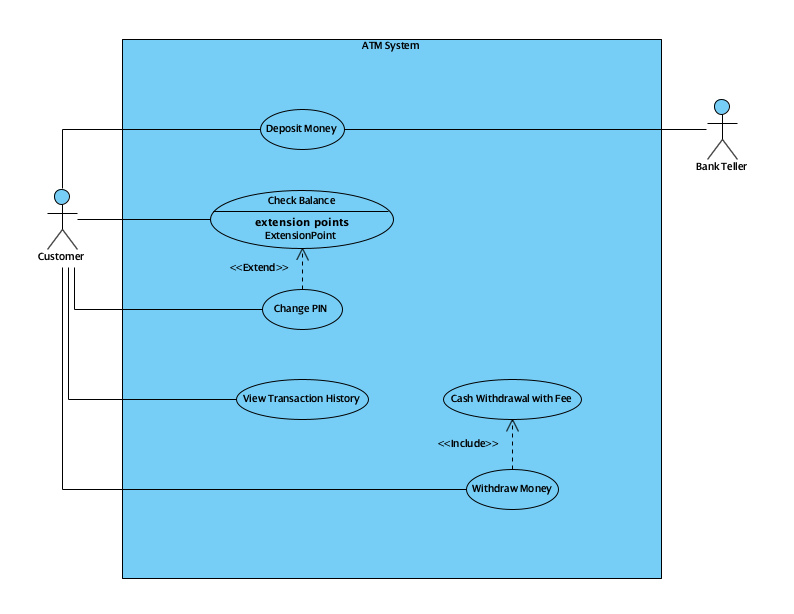
An ATM System
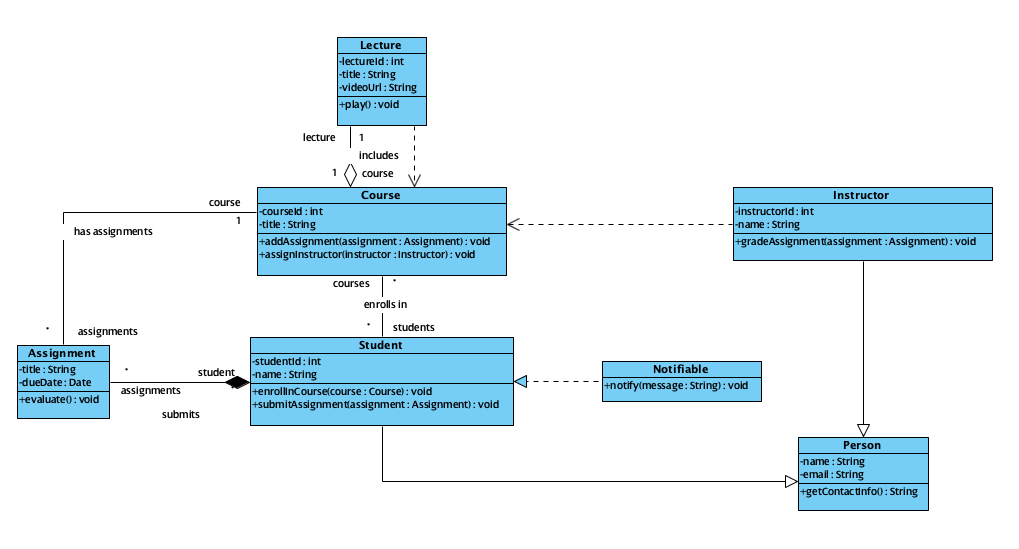
Online Learning Platform
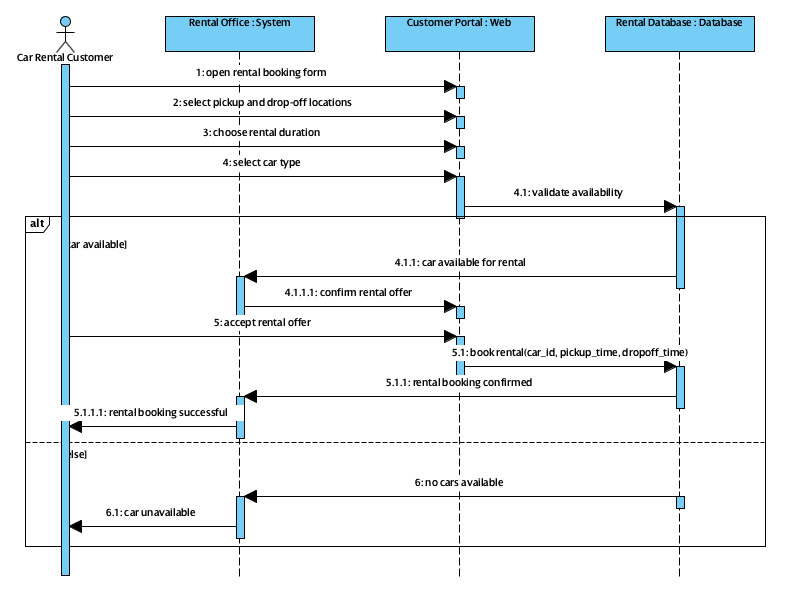
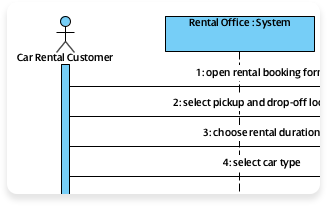
The Car Rental
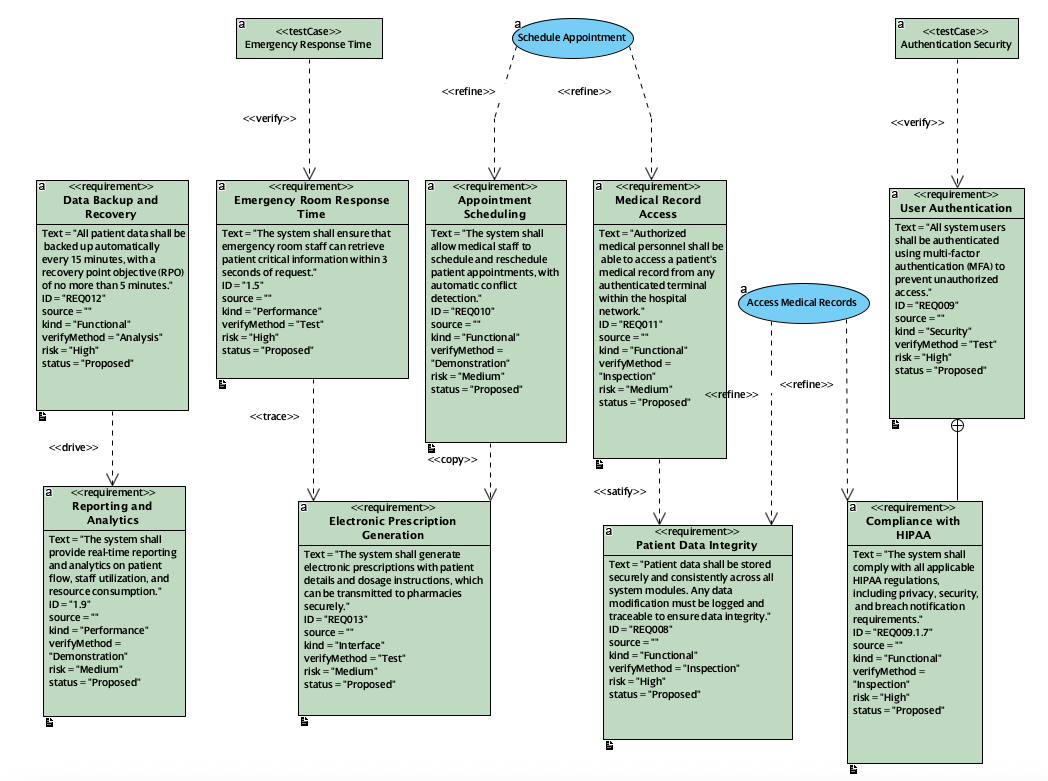
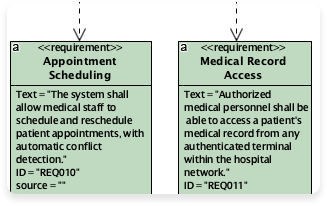
Hospital Management System
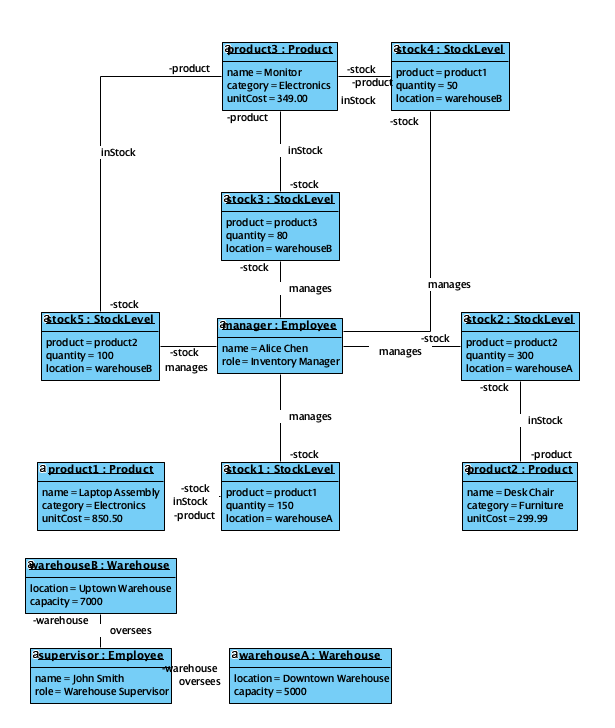
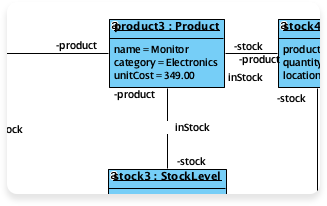
Inventory Management
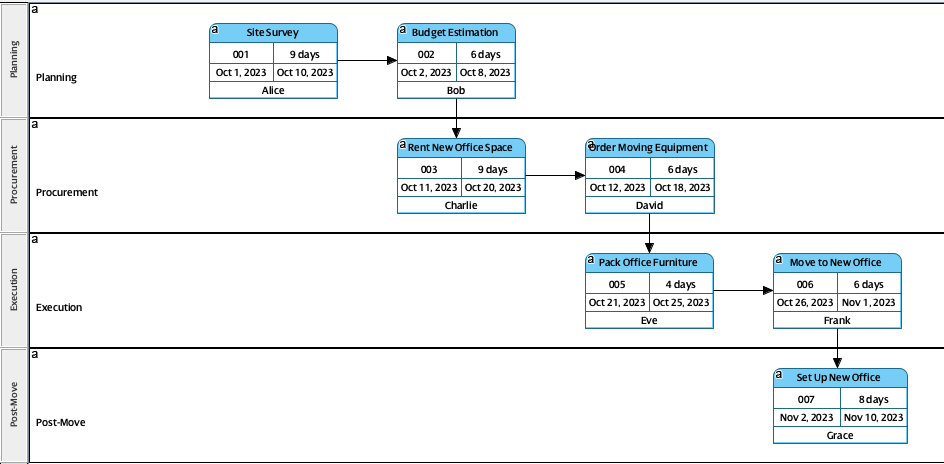
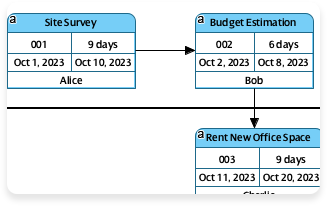
New Office Move
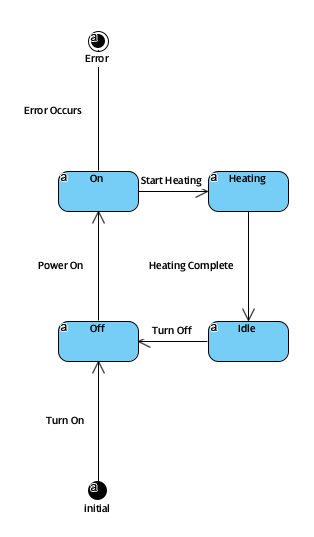
A Microwave Oven
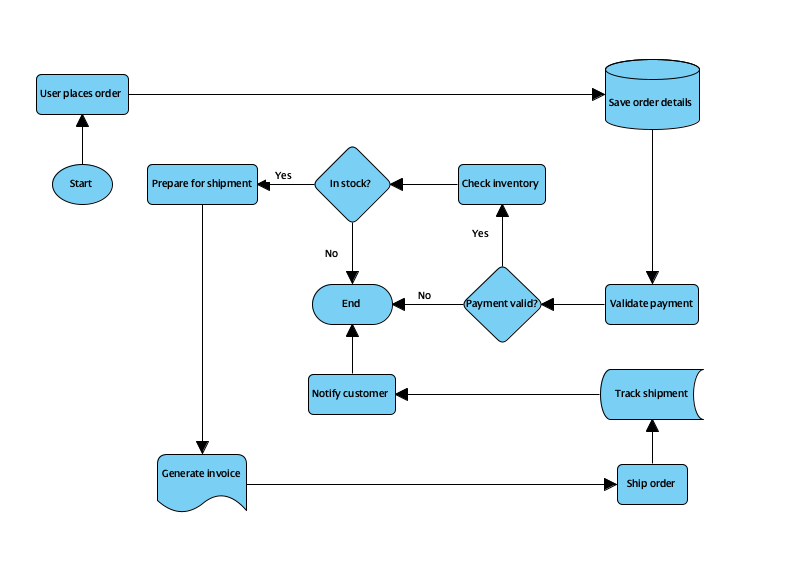
Flowchart Diagram: E-Commerce Order Fulfillment Process
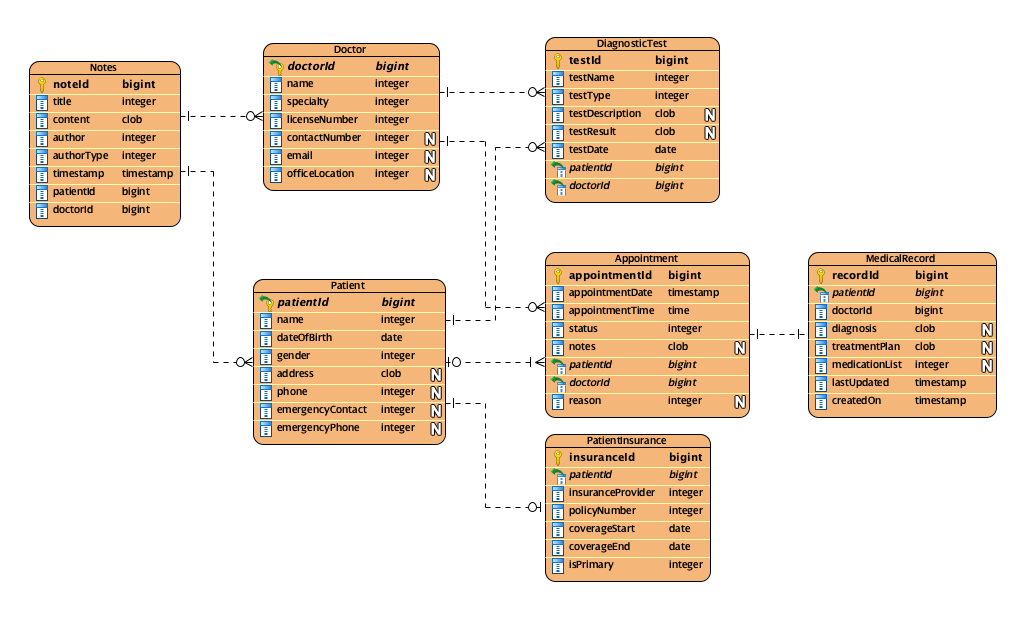
Entity Relationship Diagram for a hospital management system tracking patients, doctors, and appointments.
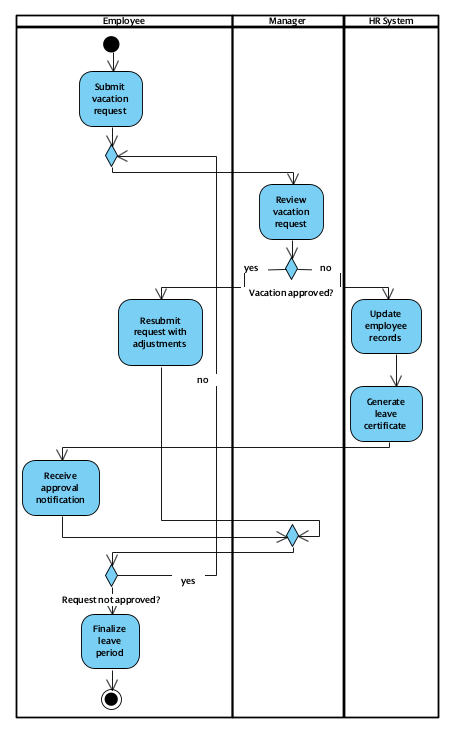
Activity Diagram for a student registering for classes and processing tuition payment.
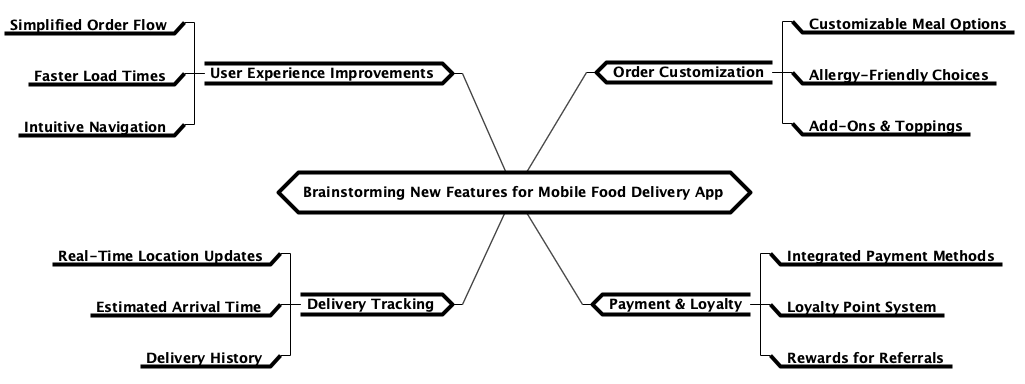
Mind Mapping Diagram for brainstorming new features for a mobile food delivery app.
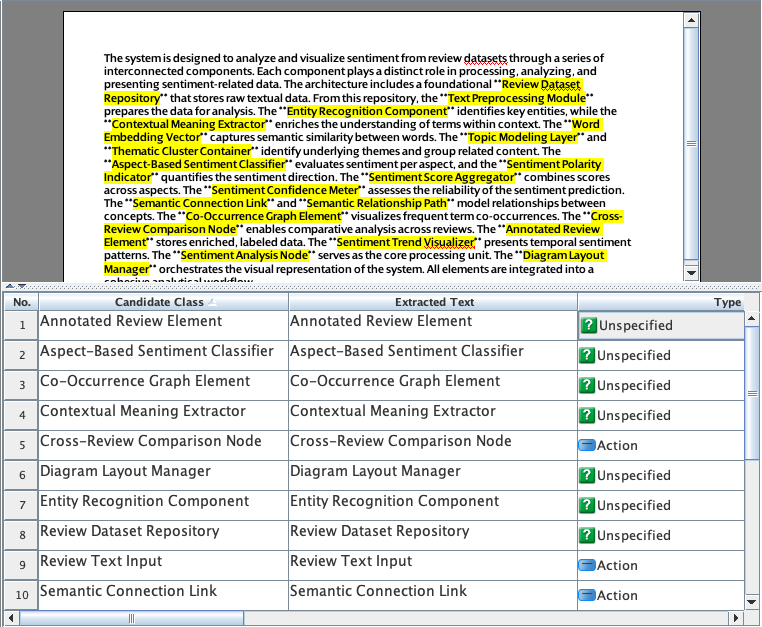
Textual Analysis Diagram for analyzing the sentiment and semantic connections within a dataset of customer product reviews.
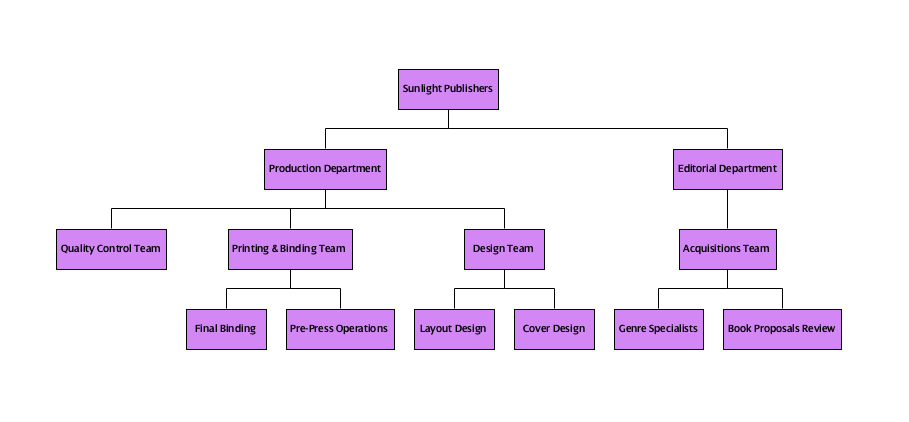
Organization Chart for the editorial and production departments of a small publishing house.
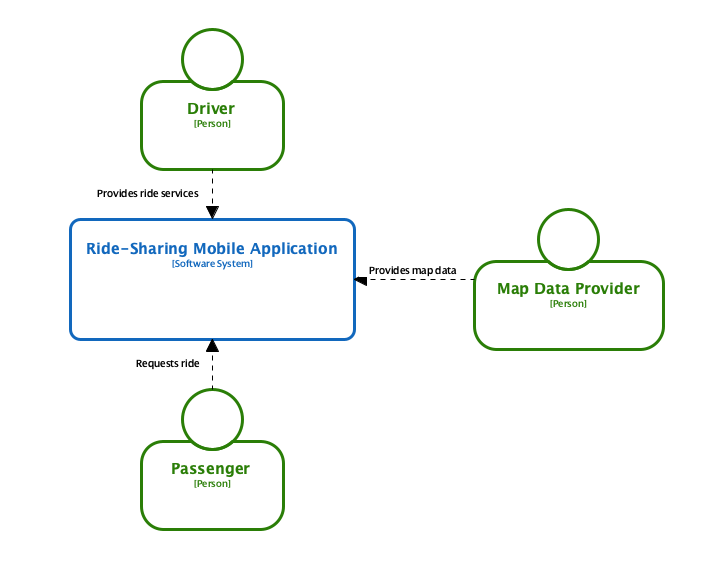
C4 Model System Context Diagram for a ride-sharing mobile application serving drivers, passengers, and map data providers.
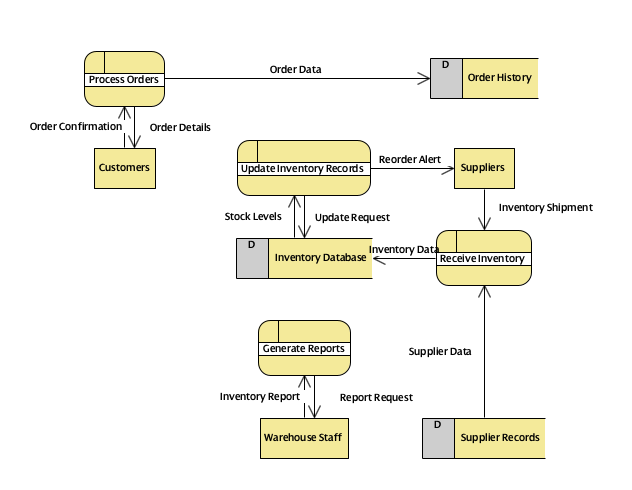
Data Flow Diagram (DFD) for a real-time inventory management system within a retail warehouse.
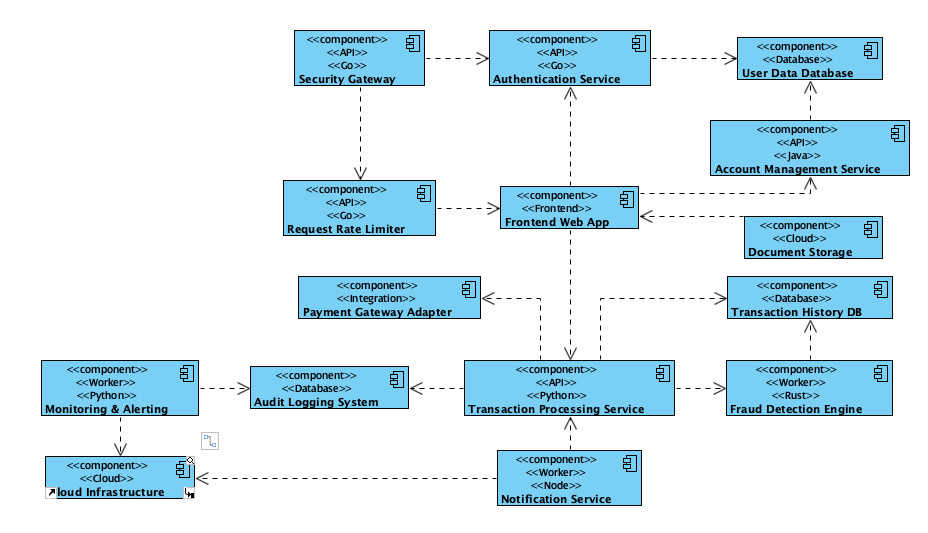
Component Diagram for a secure online banking application and its main functional modules.
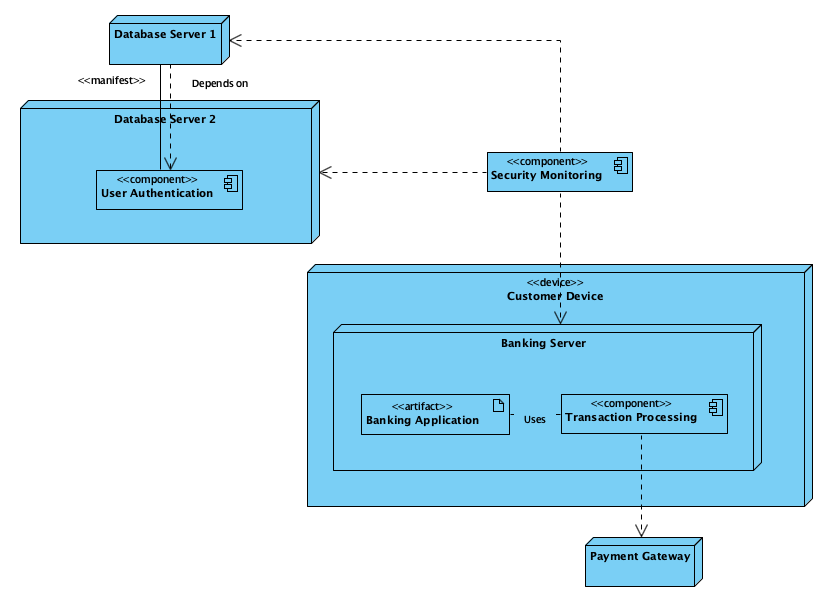
Deployment Diagram for a secure online banking system with redundant database servers.
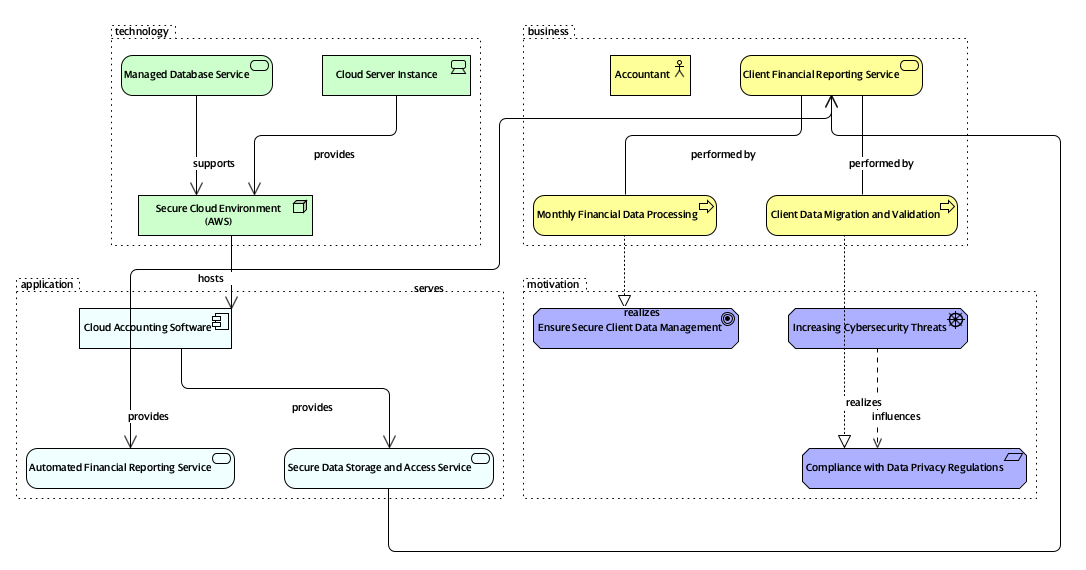
ArchiMate Diagram for a small accounting firm migrating their client data and software to a secure cloud environment.
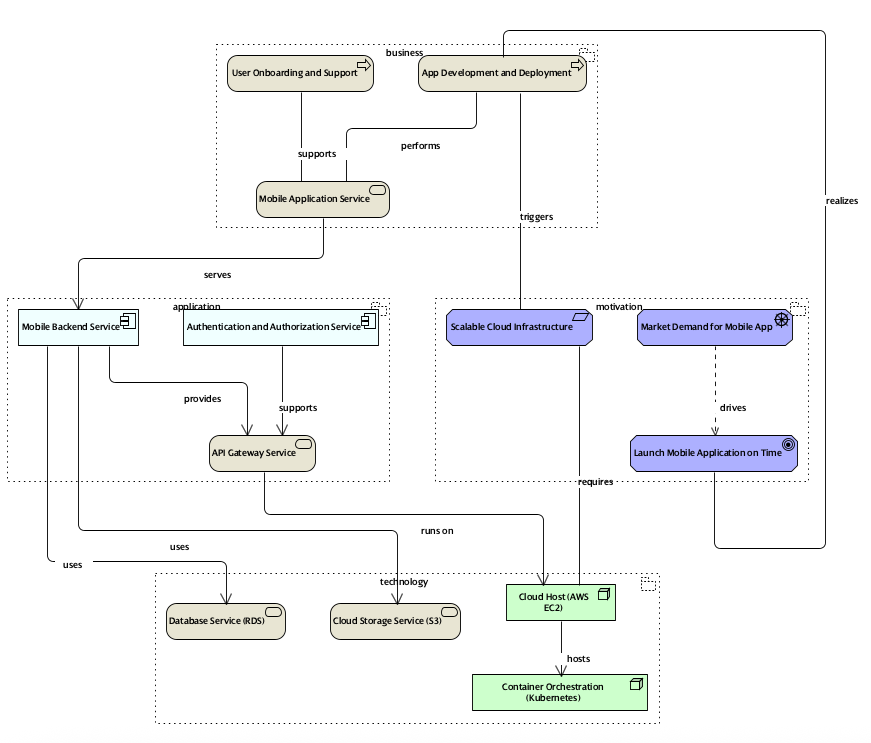
ArchiMate Diagram for a startup software company establishing their cloud infrastructure for a new mobile application.

Process Overview Diagram for the menu planning, food preparation, and customer service operations at a local bistro.
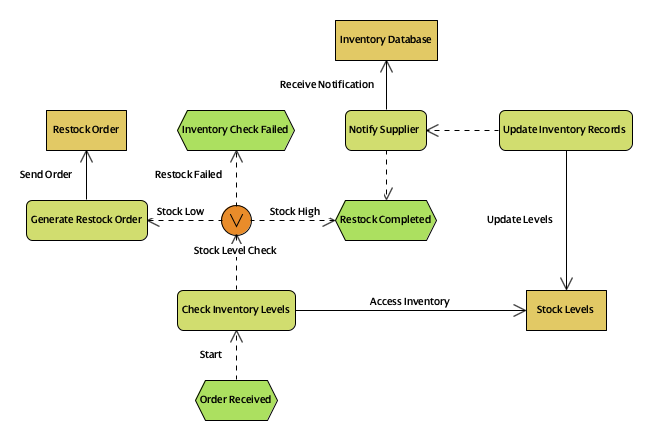
EPC Diagram for the inventory management and restocking process at a localized hardware store.
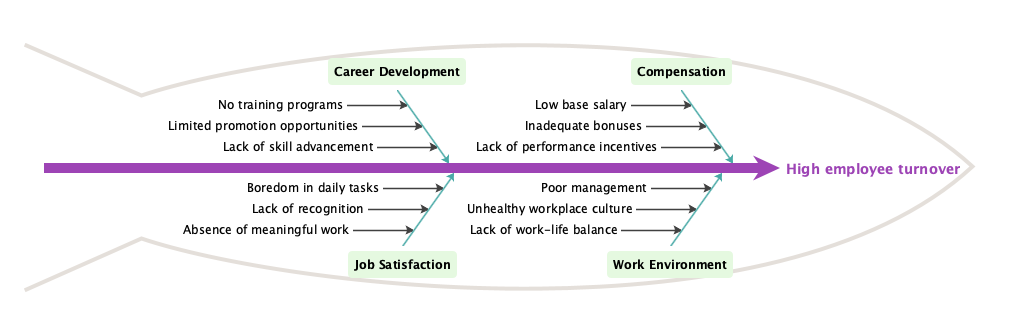
Cause and Effect Diagram for the main factors leading to high employee turnover at a small, localized restaurant.
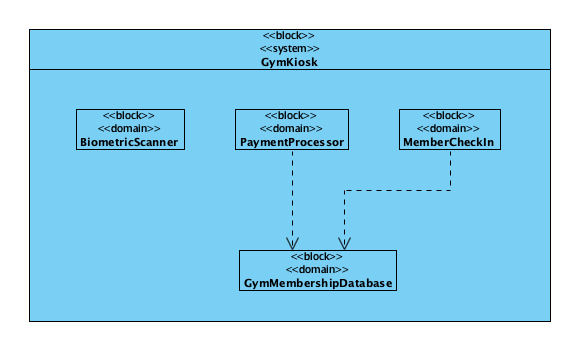
Block Definition Diagram for a local gym's integrated biometric access and member check-in kiosk.
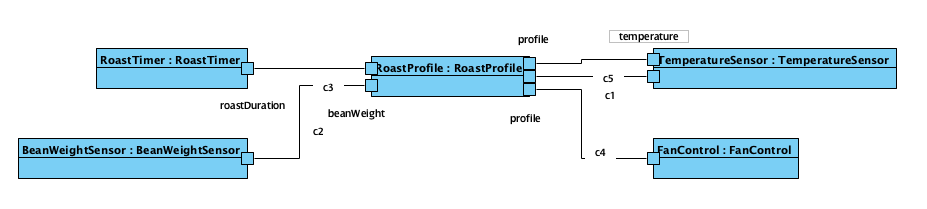
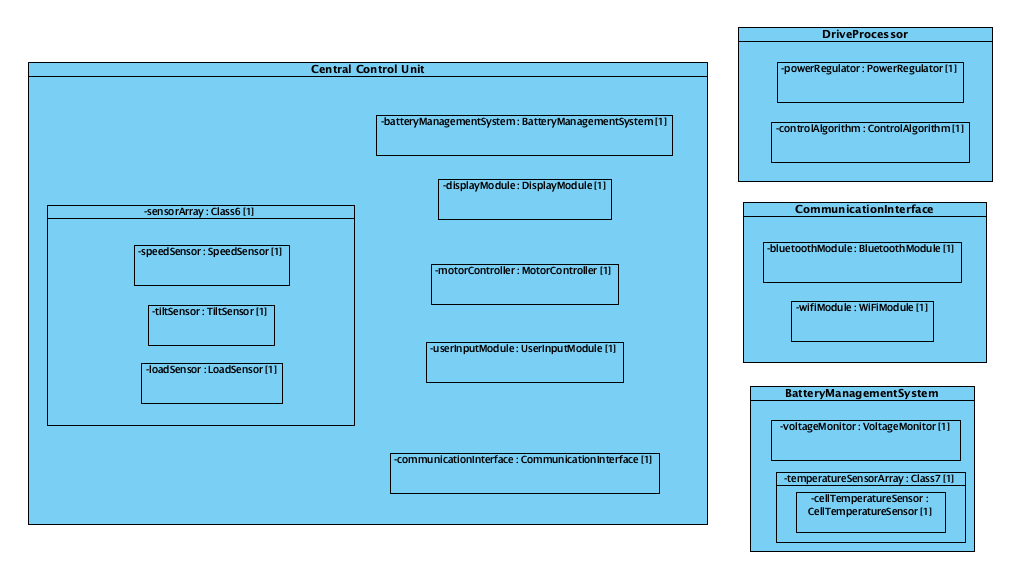
Internal Block Diagram for the internal data flow within a small coffee roastery's automated roasting control unit.
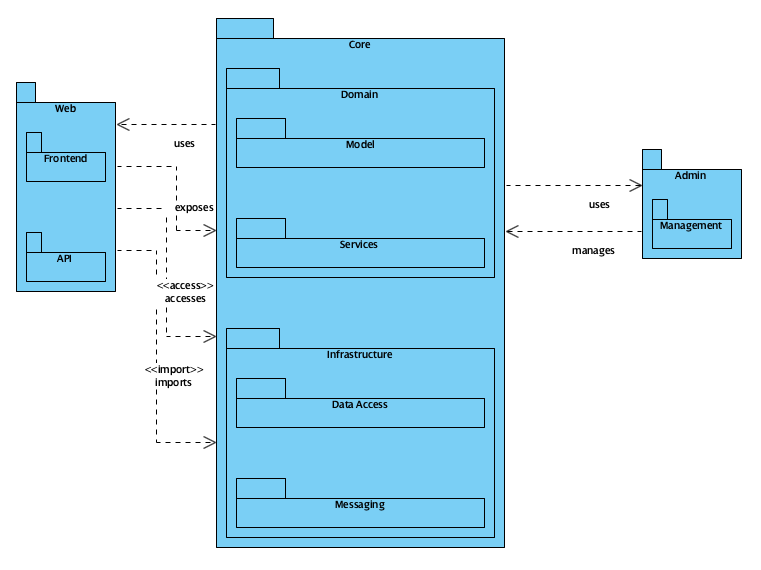
Package Diagram for the software module organization of a local boutique's e-commerce website.
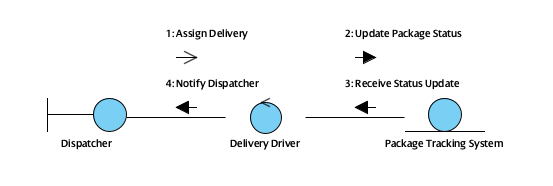
Communication Diagram for the critical messaging between a localized delivery driver, the dispatcher, and the real-time package tracking component.
Composite Structure Diagram for the dynamic interaction of runtime components inside a neighborhood garage's digitized vehicle diagnostic scanner.
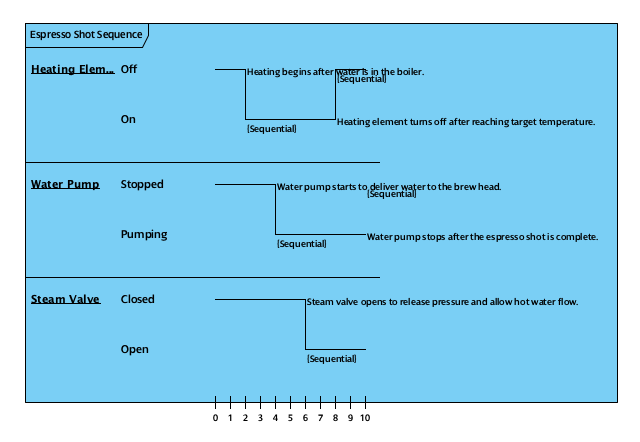
Timing Diagram for the precise state changes of the heating element, water pump, and steam valve during a single espresso shot sequence at a local cafe.
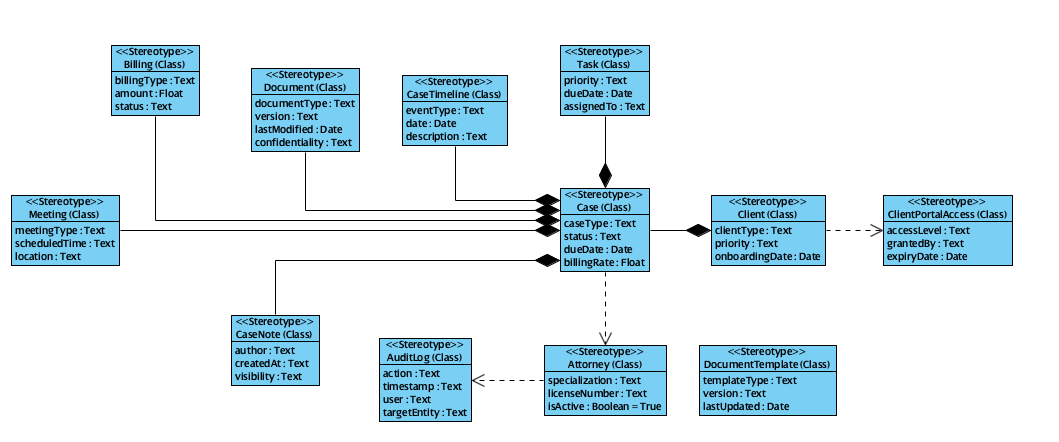
Profile Diagram for the custom modeling elements required for a boutique law firm's client and case management system.
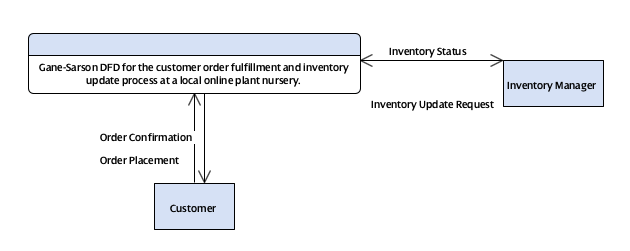
Gane-Sarson DFD for the customer order fulfillment and inventory update process at a local online plant nursery.
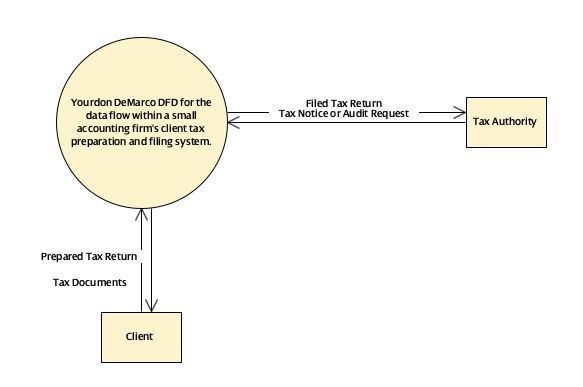
Yourdon DeMarco DFD for the data flow within a small accounting firm's client tax preparation and filing system.
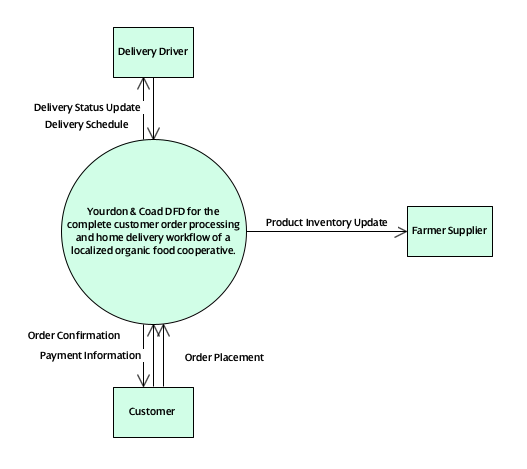
Yourdon & Coad DFD for the complete customer order processing and home delivery workflow of a localized organic food cooperative.
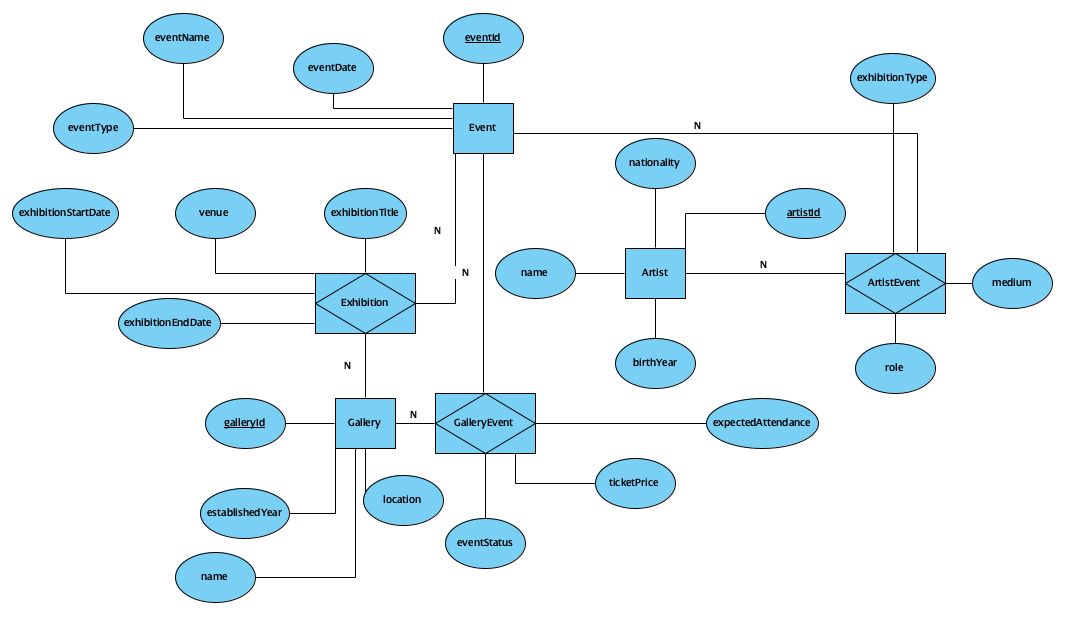
Chen Notation ERD for the relationship between artists, galleries, and events for a small, specialized art agency.
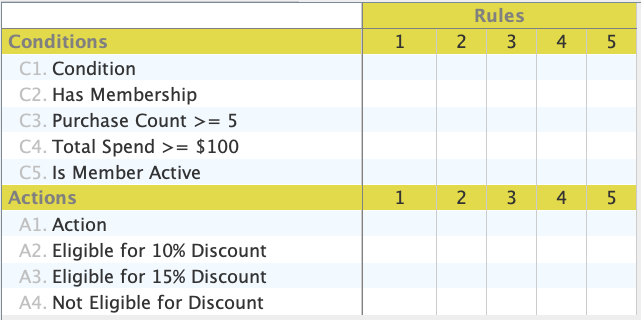
Decision Table for the discount eligibility rules for a local bookstore's loyalty program based on purchase history and membership status.
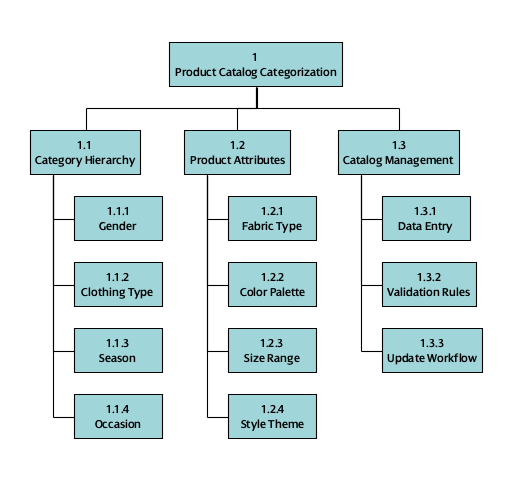
Breakdown Structure Diagram for the product catalog categorization for a boutique specialized clothing store.
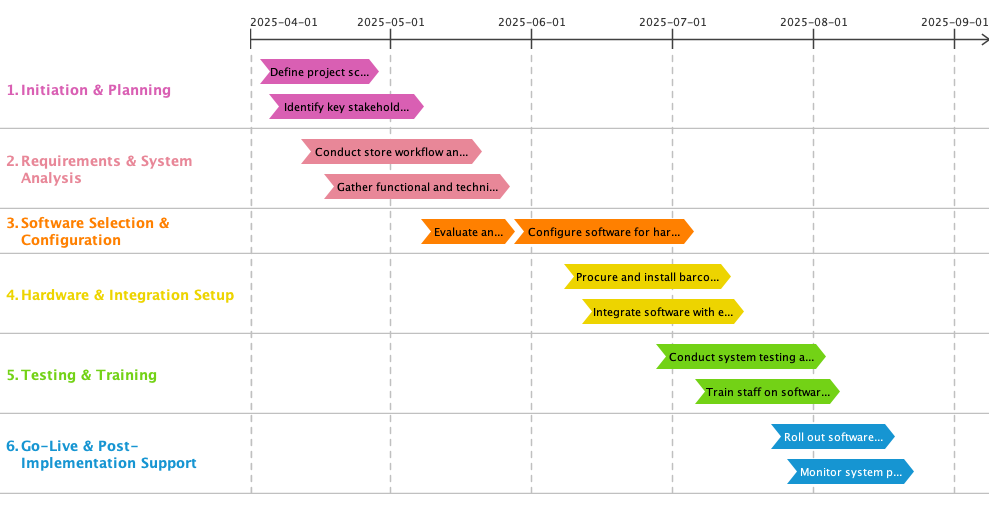
Implementation Plan Diagram for the rollout of an automated inventory tracking software at a small hardware store.
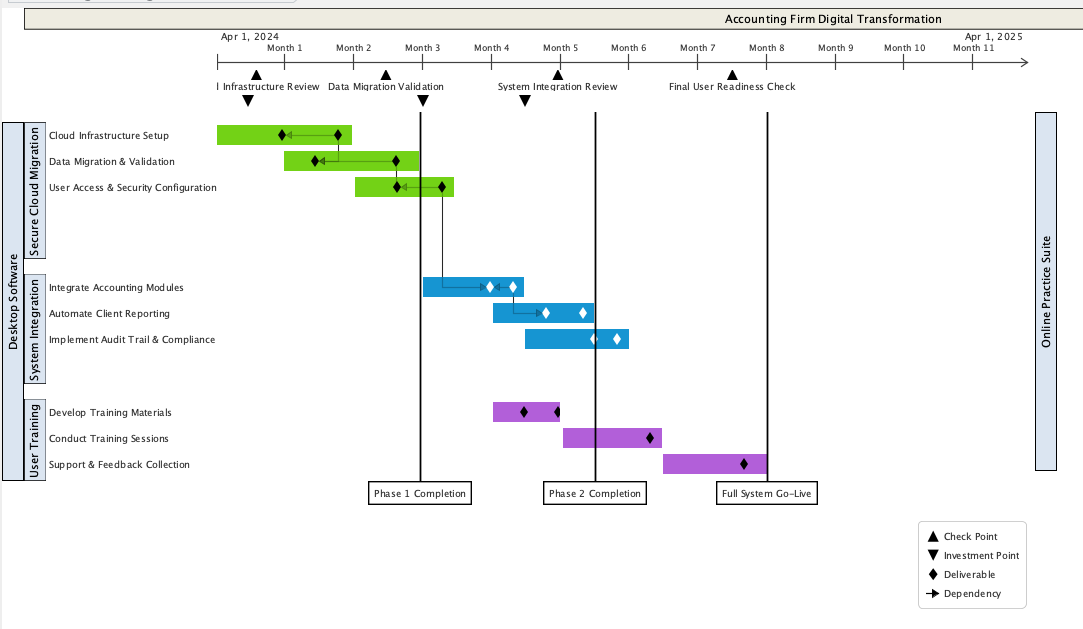
Migration Roadmap for transitioning a small accounting firm from desktop-based software to a secure online practice management suite.
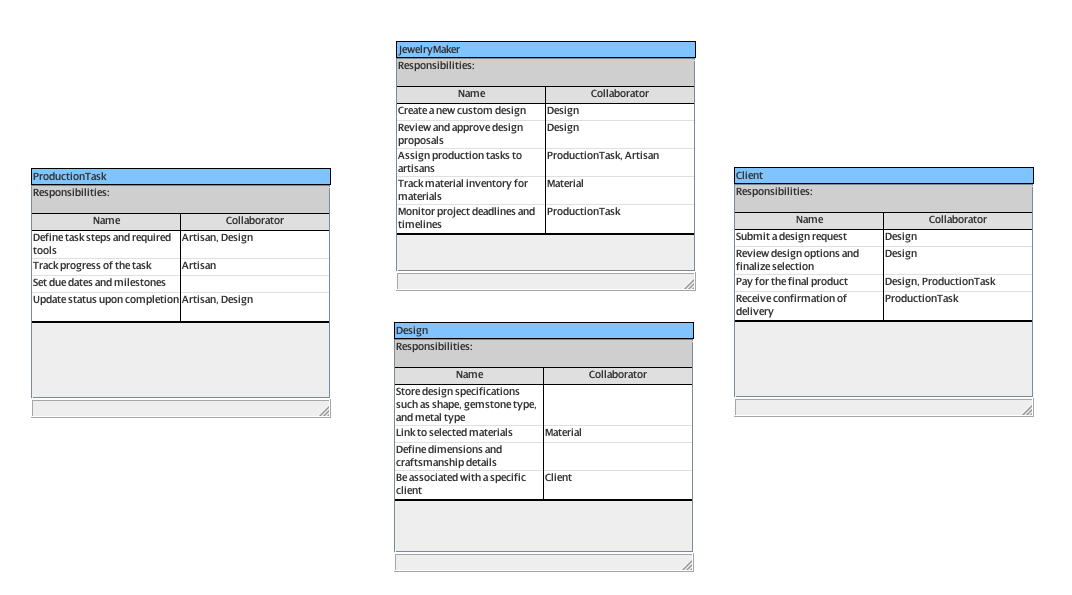
CRC Card Diagram for modeling the distinct types of objects and their interactions for a specialized jewelry maker's custom design and production management workflow.
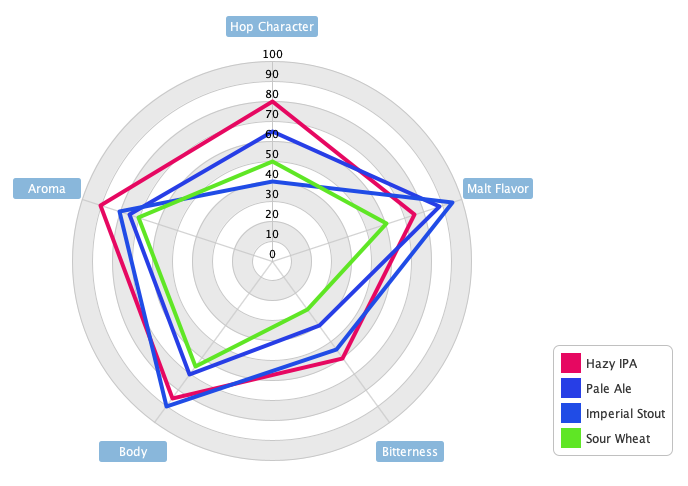
Radar Chart for visualizing the distinct flavor profiles of four original craft beer blends from a small, localized microbrewery.
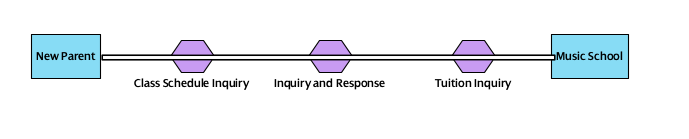
Conversation Diagram for the complete inquiry process for a new parent seeking information from a local music school.