Data Flow Diagram: Examples - Food Ordering System
Data Flow Diagram (DFD) provides a visual representation of the flow of information (i.e. data) within a system. By drawing a Data Flow Diagram, you can tell the information provided by and delivered to someone who takes part in system processes, the information needed to complete the processes and the information needed to be stored and accessed.This article describes and explains the Data Flow Diagram (DFD) by using a food ordering system as an example.
The Food Ordering System Example
Context DFD
A context diagram is a data flow diagram that only shows the top level, otherwise known as Level 0. At this level, there is only one visible process node that represents the functions of a complete system in regard to how it interacts with external entities. Some of the benefits of a Context Diagram are:
- It shows an overview of the boundaries of a system.
- No technical knowledge is required to understand it, thanks to its simple notation.
- It is simple to draw, amend, and elaborate on due to its limited notation.
The figure below shows a context Data Flow Diagram that has been drawn for a Food Ordering System. It contains a process (shape) that represents the system to be modeled, in this case, the "Food Ordering System." It also shows the participants who will interact with the system, called external entities. In this example, the Supplier, Kitchen, Manager, and Customer are the entities who will interact with the system. In between the process and the external entities, there are data flows (connectors) that indicate the existence of information exchange between the entities and the system.
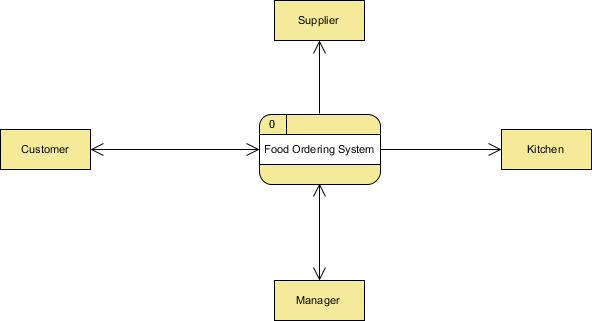
A Context DFD is the entrance to a data flow model. It contains one and only one process and does not show any data stores.
Level 1 DFD
The figure below shows the level 1 DFD, which is the decomposition (i.e., breakdown) of the Food Ordering System process shown in the context DFD. Read through the diagram, and then we will introduce some of the key concepts based on this diagram.

The Food Order System Data Flow Diagram example contains three processes, four external entities, and two data stores.
Based on the diagram, we know that a Customer can place an Order. The Order Food process receives the Order, forwards it to the Kitchen, stores it in the Order data store, and stores the updated Inventory details in the Inventory data store. The process also delivers a Bill to the Customer.
The Manager can receive Reports through the Generate Reports process, which takes Inventory details and Orders as input from the Inventory and Order data stores, respectively.
The Manager can also initiate the Order Inventory process by providing an Inventory order. The process forwards the Inventory order to the Supplier and stores the updated Inventory details in the Inventory data store.
Data Flow Diagram Tips and Cautions
Tips
- Process labels should be verb phrases; data stores are represented by nouns.
- A data store must be associated with at least one process.
- An external entity must be associated with at least one process.
- Don't let it get too complex; normally, 5-7 processes are manageable for the average person.
- DFDs are non-deterministic—the numbering does not necessarily indicate a sequence, but it is useful for identifying processes when discussing with users.
- Data stores should not be connected to an external entity; otherwise, it would mean that you're giving an external entity direct access to your data files.
- Data flows should not exist between two external entities without going through a process.
- A process that has inputs but no outputs is considered a "black-hole" process.
Cautions
Don't mix up data flow and process flow
Some designers may feel uncomfortable when they see a connector connecting from a data store to a process without the step of a data request being shown on the diagram. Some of them will try to represent a request by adding a connector between a process and a data store and labeling it "a request" or "request for something," which is wrong.
Keep in mind that a Data Flow Diagram is designed to represent the exchange of information. Connectors in a Data Flow Diagram are for representing data, not for representing a process flow, step, or anything else. When we label a data flow that ends at a data store "a request," this literally means we are passing a request as data into a data store. Although this may be the case at the implementation level, as some DBMSs do support the use of functions that take in some values as parameters and return a result, in a Data Flow Diagram, we tend to treat a data store as a sole data holder that does not possess any processing capability. If you want to model the system flow or process flow, you could use a UML Activity Diagram or a BPMN Business Process Diagram instead. If you want to model the internal structure of a data store, you can use an Entity Relationship Diagram.